Color Measurement – StellarPro Quick Start
- Turn on the computer. Open the StellarNet software by double clicking on the desktop icon StellarPro
 to open the application.
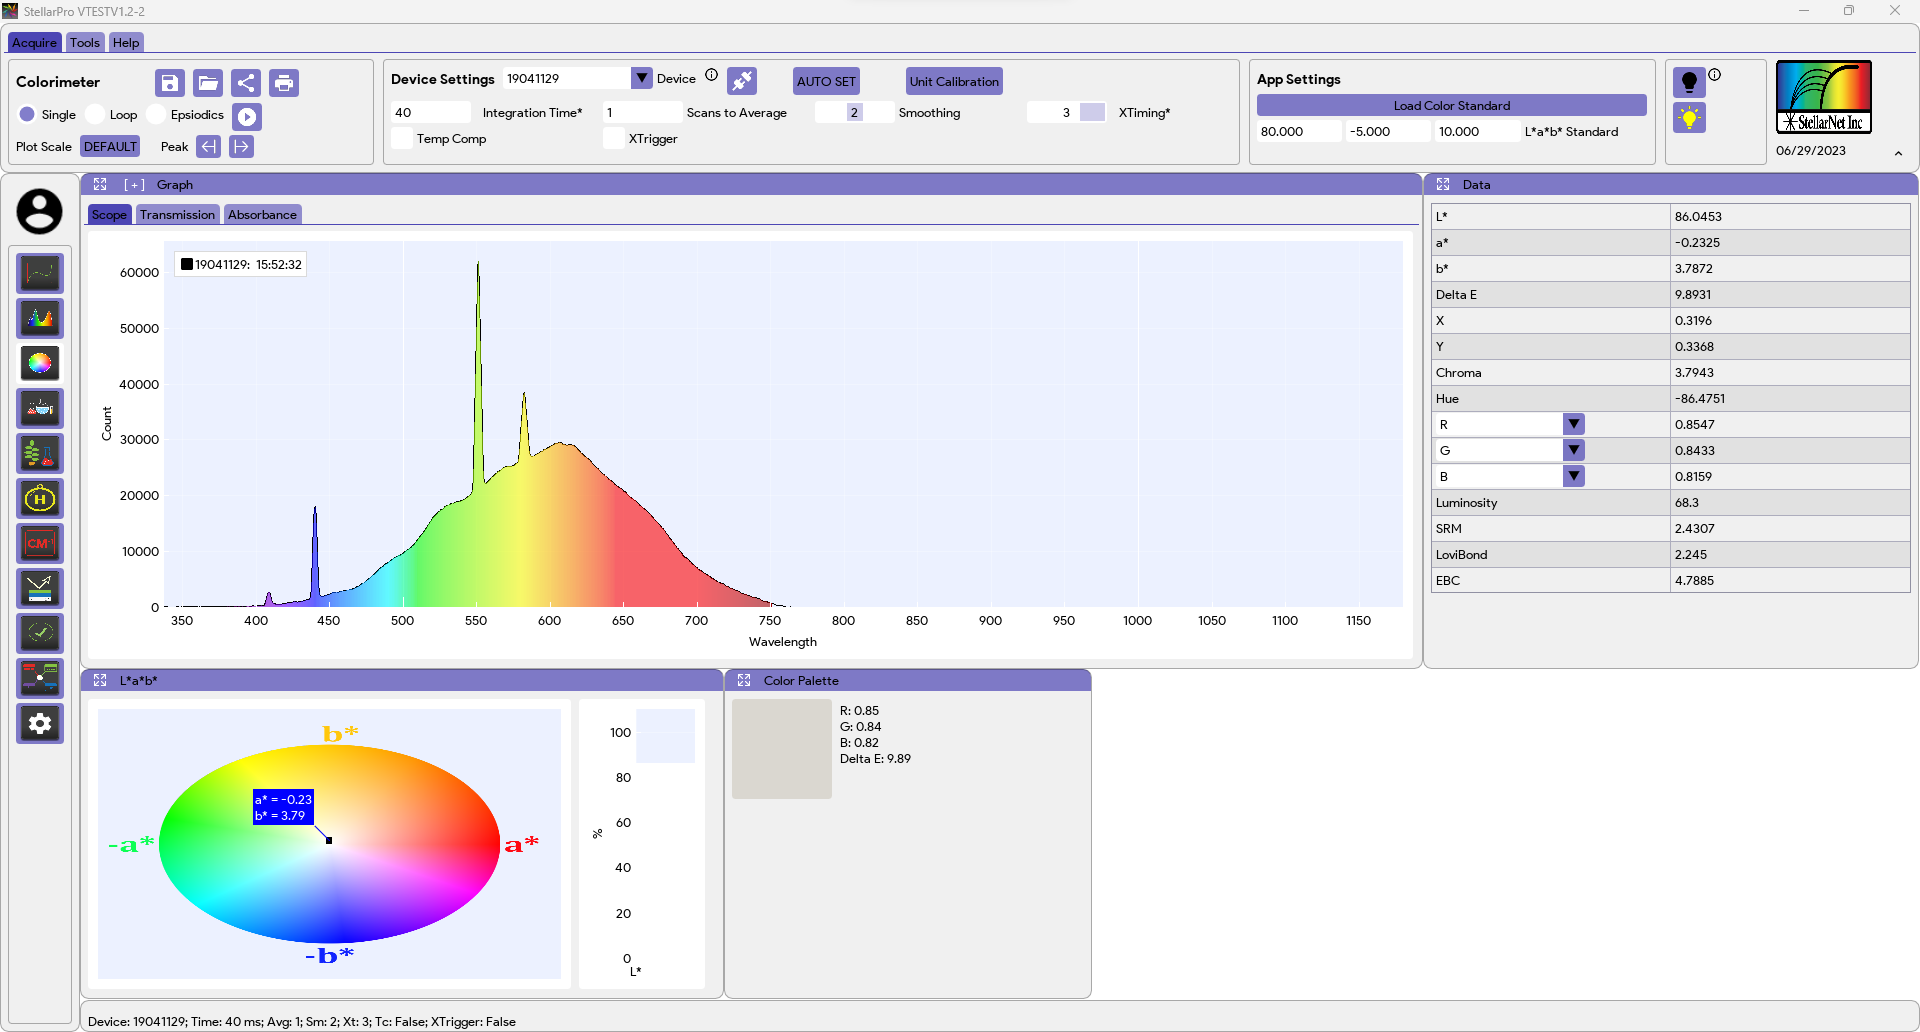
 - When you first open the software, you should see a screen similar to the one below:
- In the side navigation bar, select Colorimeter icon
 .
. - Place the RS50 White Reflectance Standard (or any other reflectance standard with the provided RCD file loaded) under the probe and turn on the light source.
- Click on the Scope tab in the Graph window. This will show you the number of counts (photons) the detector receives. You should see a spectrum of counts versus wavelength.
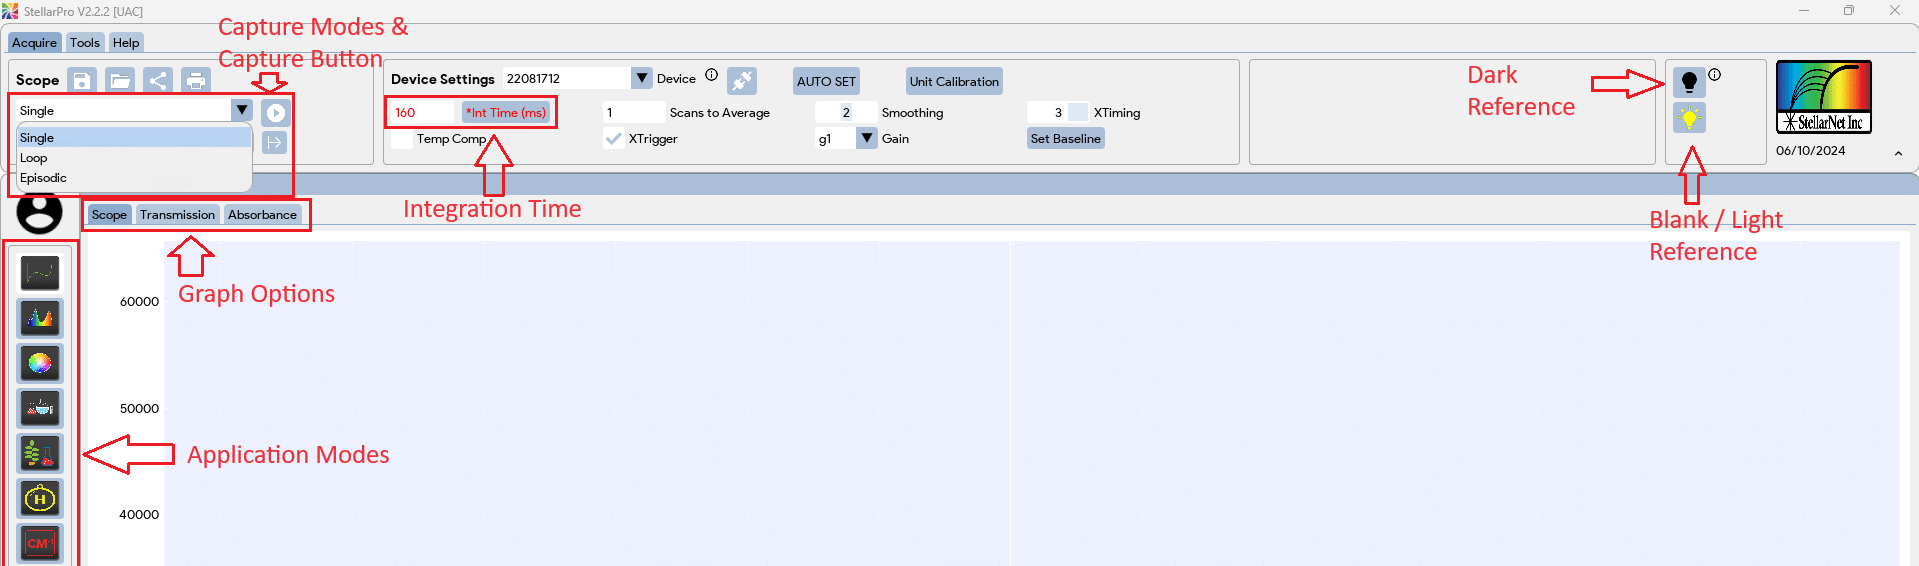
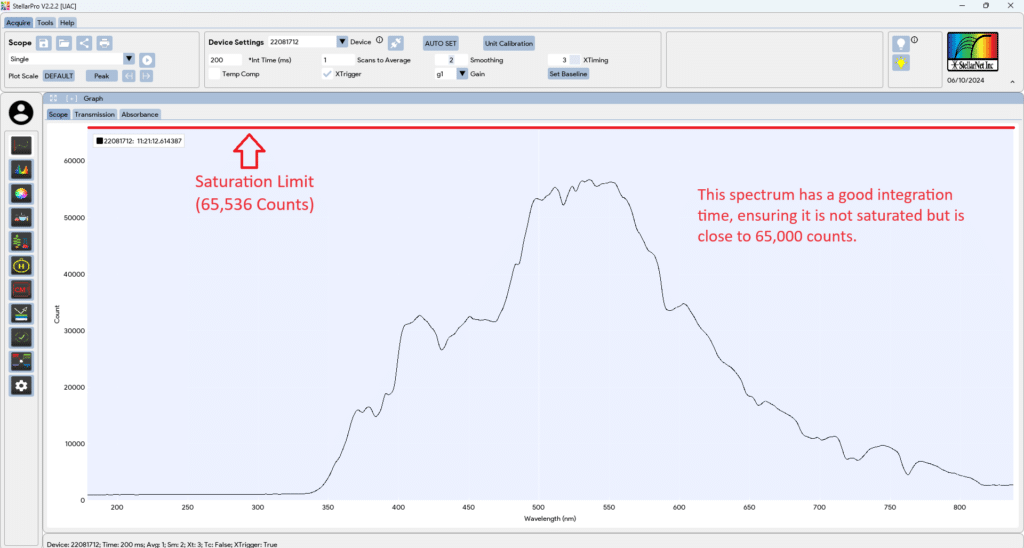
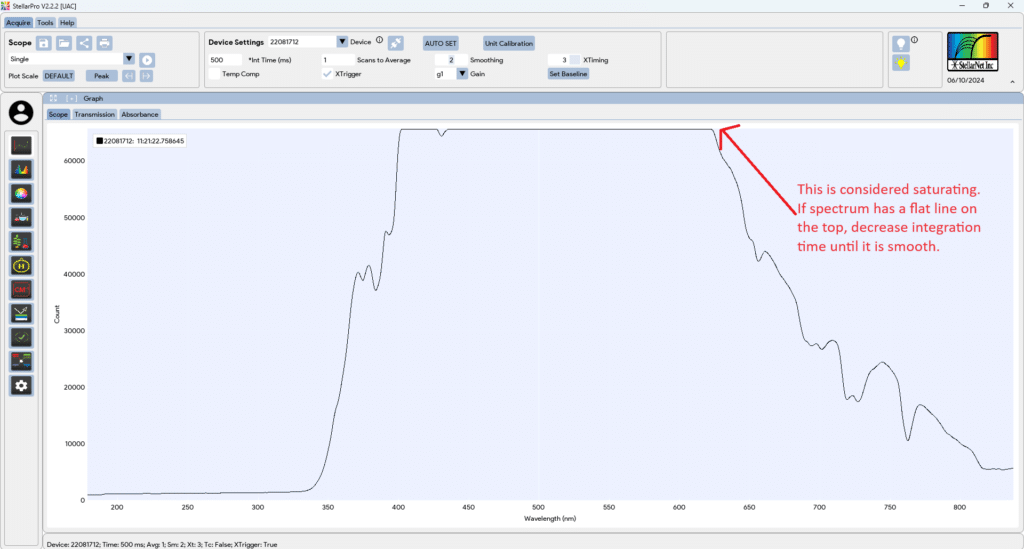
- In Acquire toolbar, set the integration time so that your spectrum is not saturated but as close to 65,000 counts as possible. Enter the desired time in the integration time input box, then click on the “Int Time (ms)” button next to the input textbox to apply the entered time. The goal is to maximize your signal in SCOPE mode. You want to adjust your integration time until the spectrum fills most of the SCOPE graph (65,000) without saturating. This is also the point at which you should adjust the number of scans to average (more scans averaged will increase accuracy, but will take more time for each reading). You can also add smoothing controls at this time in the Device Settings block. A pixel box car set to 3 and averaging set to 5 often gives nice results.
- In the first picture below, the spectrum is correctly optimized to be just below the saturation limit (65,536 counts).

- In the second picture below, the spectrum have a flat line on the top, indicating the need to reduce the integration time.

- In the first picture below, the spectrum is correctly optimized to be just below the saturation limit (65,536 counts).
- Turn off the light source, then left click on the Dark Reference button,
 or
or  , in the toolbar at the top right of the screen. You will see your baseline drop to zero.
 - Take the light reference by left clicking on the yellow light bulb icon
 in the toolbar at the top of the screen.
 - Place sample under probe.
- Select the desired data collection mode
 and press the capture icon
  to start the acquisition. Colorimetric values will be displayed in the Data, Lab*, and Color Palette windows.
 .
.
 or
or  , in the toolbar at the top right of the screen. You will see your baseline drop to zero.
 in the toolbar at the top of the screen.
 and press the capture icon
  to start the acquisition. Colorimetric values will be displayed in the Data, Lab*, and Color Palette windows.