
The Radiometer app offers comprehensive and detailed analysis for light sources, encompassing various aspects such as light power, quality, color, and temperature. It serves as a valuable tool for examining and understanding the characteristics of different light sources in a thorough manner.
App setting
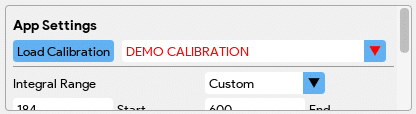
| The Load Calibration button allows users to load existing calibrations (left-click) or create new ones (right-click). A dropdown list displays registered/loaded cal files for selection | |
|
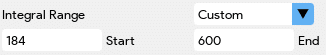
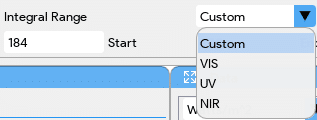
The Integral Range option enables users to define start and end wavelengths for area calculations (watts/m², lumens, PAR). Custom or pre-defined ranges can be chosen. |
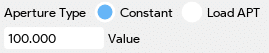 |
The Aperture Type selection includes constant aperture or loading an APT file for wavelength-specific aperture compensation. Default is 100% transmission (no aperture). Each CR2-AP value represents approximately 10% transmission. |
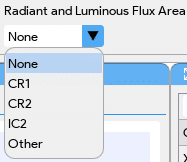 |
For Radiant and Luminous Flux Area calculations, options include CR1 (11 mm), CR2 (6 mm), IC2 (0.625 inch), user-defined, or None (default = 1 m²). Radiant flux = irradiant power * receptor area, while luminous flux = illuminance * receptor area. |
Windows
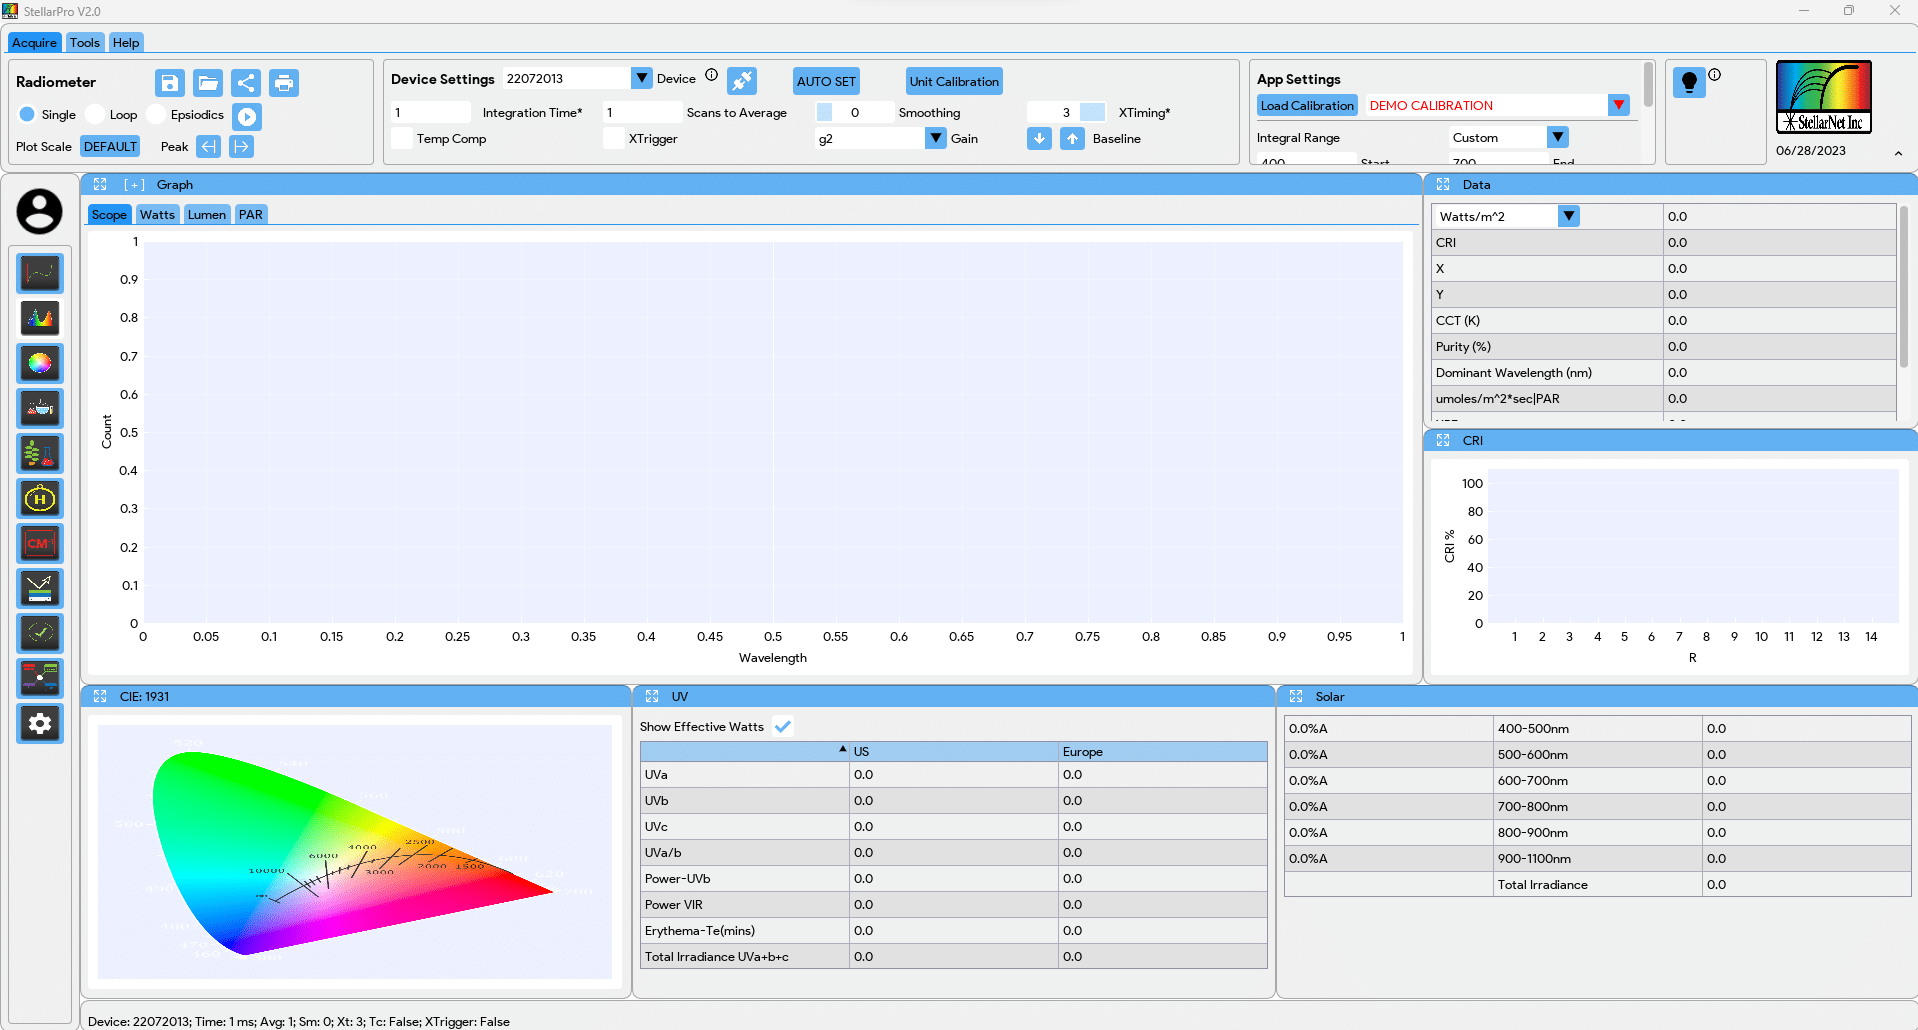
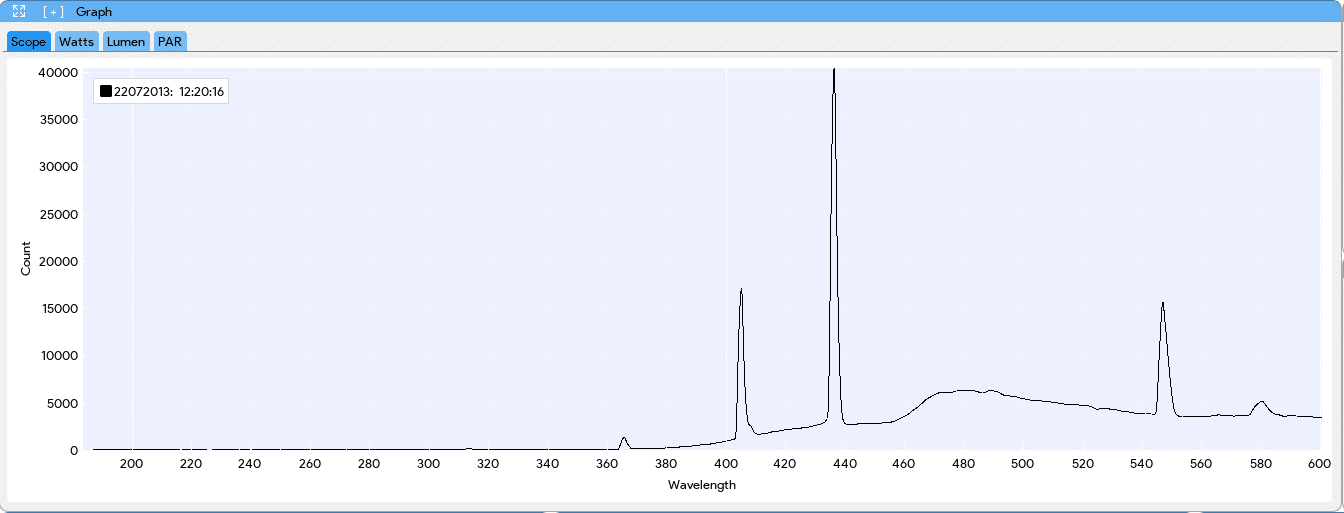
- The Graph Window in the software showcases various graphs relevant to radiometer and light analysis. It includes graphs such as the Watts graph, Lumen graph, PAR graph, and other graphs specific to power analysis, spectral distribution, or light intensity. Each graph provides visual representation and insights into different aspects of light measurement and analysis.
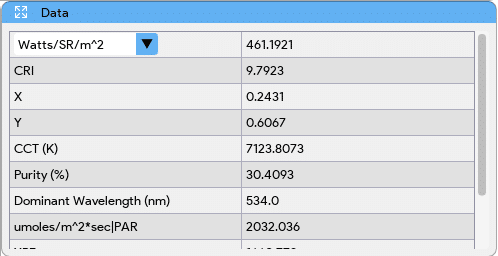
- The Data Window is a section where users can find numerical values associated with light power, quality, color, and temperature. It includes measurements such as irradiance, illuminance, radiant flux, color rendering index (CRI), color temperature, and other relevant parameters. Users can refer to this window to obtain precise numerical data and make quantitative assessments.
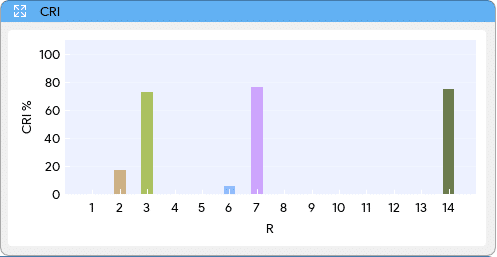
- The CRI Window specifically focuses on displaying the color rendering index (CRI) values from R1 to R14. CRI measures how accurately a light source reproduces colors compared to natural light. By plotting the CRI values, users can evaluate the color fidelity and accuracy of the light source across different color samples or objects.
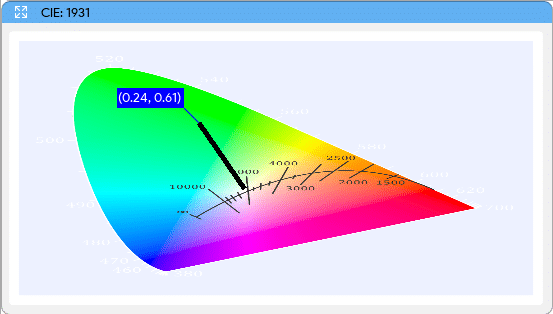
- The CIE 1931 Plot within the Data Window presents x-y chromaticity coordinates, which define the light color and temperature based on the CIE 1931 color space. The plot represents the chromaticity diagram, enabling users to visually understand the color properties of the light source. By analyzing the x-y coordinates, users can determine the color hue, saturation, and correlated color temperature (CCT) of the light.
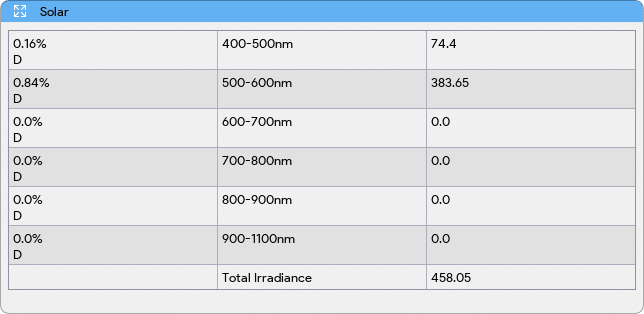
- The Solar Window provides insights into the power distribution of solar light across the 400-1100 nm wavelength range. It breaks down the solar spectrum into specific regions and displays the solar irradiance values. This information helps in understanding the characteristics of solar radiation for applications such as solar energy, photovoltaics, and solar simulation.
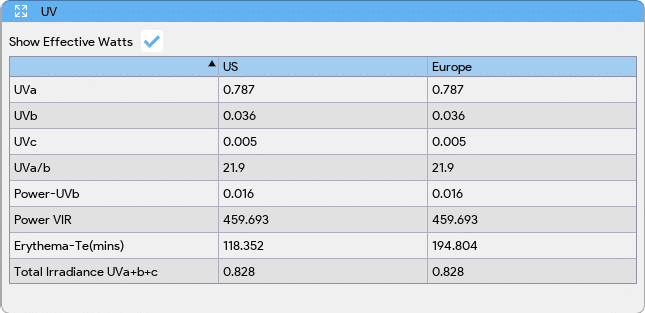
- The UV Window focuses on the analysis of ultraviolet (UV) radiation. It provides metrics for UVa, UVb, and UVc based on both US and European standards. Users can examine the intensity or dosage of UV radiation in each category and make assessments for UV-related applications, including skin protection, UV disinfection, and photobiology studies.
Overall, these sections within the software provide users with detailed information and visual representation of various aspects of light analysis, enabling them to make informed decisions and interpretations based on the measured data.