
ChemWiz Analyzer Development Kit
Full spectrum chemometric analysis for multiple components can now be performed using our FREE StellarPro Chemwiz ADK AppRadiometry, Colorimetry, Chemistry, Biology, Physics and more.
ChemWiz Analyzer Development Kit
StellarPro™ Free Chemometric Model Builder
& Wizard Runtime Engine
StellarNet Spectrometer Hardware
NIR Spectrometers (900-2500nm)
Light Sources, Fibers, Accessories

Applications
Plastics &Polymers
Pharmaceutical & Supplement
Chemical & Industrial
 ChemWiz App Model Builder Software & Wizard Runtime Engine
Full spectrum chemometric analysis for multiple components can now be performed using our StellarPro Chemwiz ADK (Analyzer Development Kit) App. This software, when combined with StellarNet spectrometer instrumentation, enables rapid development of complex analyzers needed to provide custom measurement solutions for many applications.
Real-time spectral data is used as input to measure concentrations of up to 6 components such as moisture, fat, protein, alcohols, acids, or chemicals such as pesticides. Alternatively, the ChemWiz® ADK can be used to classify samples, such as the types of plastics, nutraceuticals, raw ingredients, and more.
The Chemwiz ADK App includes a model builder which is used to process spectra from a set of known component concentrations. Here the spectral pre-processing techniques are selected such as multivariate scatter correction (MSC), smoothing, derivatives, and mean centering. The multivariate analysis type is then selected such as partial least squares (PLS). Finally a cross validation technique is chosen and used to improve the reported statistics indicating accuracy and fitness of the calibration model created.
The ADK includes a runtime engine that performs the analysis in real-time with little to no sample preparation.
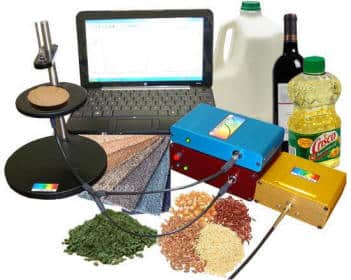
Each analyzer system can be tailored with sampling accessories to measure liquids, solids, and powders. For liquids, absorbance is measured via flow cells, dip probes, or cuvettes. For solids and powders, reflectance is typically used to measure sample absorbance. Near infrared diode array spectrometers such as the DWARF-Star NIR-512 with TEC cooling are typically configured for analyzer development.
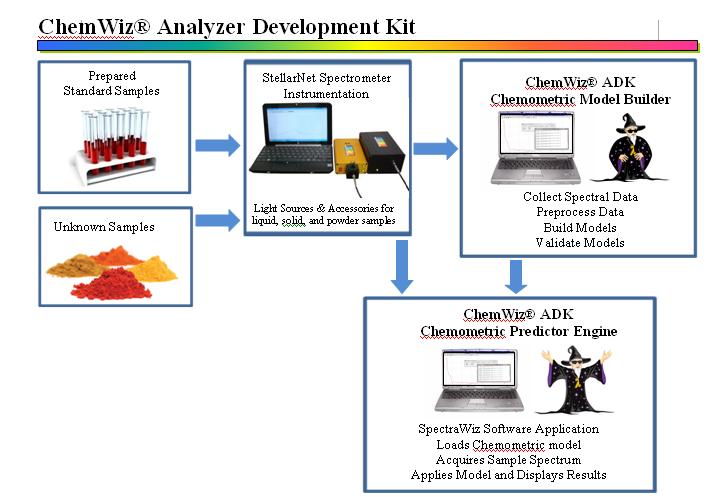
Flow Chart of Analyzer Development
1. Prepare a set of Standard Samples with known concentrations of the parameter of choice (moisture, fat, fiber, etc..). Generally the Standard samples will be prepared by the end user and sent to a laboratory for chemical analysis. (rtech labs).
2. Collect spectra of each Standard Sample using StellarNet Spectrometer Instrumentation.
3. Load collected Spectra into the chemometric model builder and select (a) desired wavelengths of calibration (b) spectral preprocessing (c) cross validation methods (d) and model of choice.
4. Once the calibration model is built it can be verified using statistics indicating accuracy and fitness of the model. The end user may build many different models for different sample types and matrices (i.e. different types of cheese powders may require separate models for the highest accuracy of prediction).
5. Load model file into SpectraWiz and open ChemWiz Chemometric predictor panel to view calculation of your parameters of choice from each collected spectrum in real-time.
ChemWiz-ADK App Features
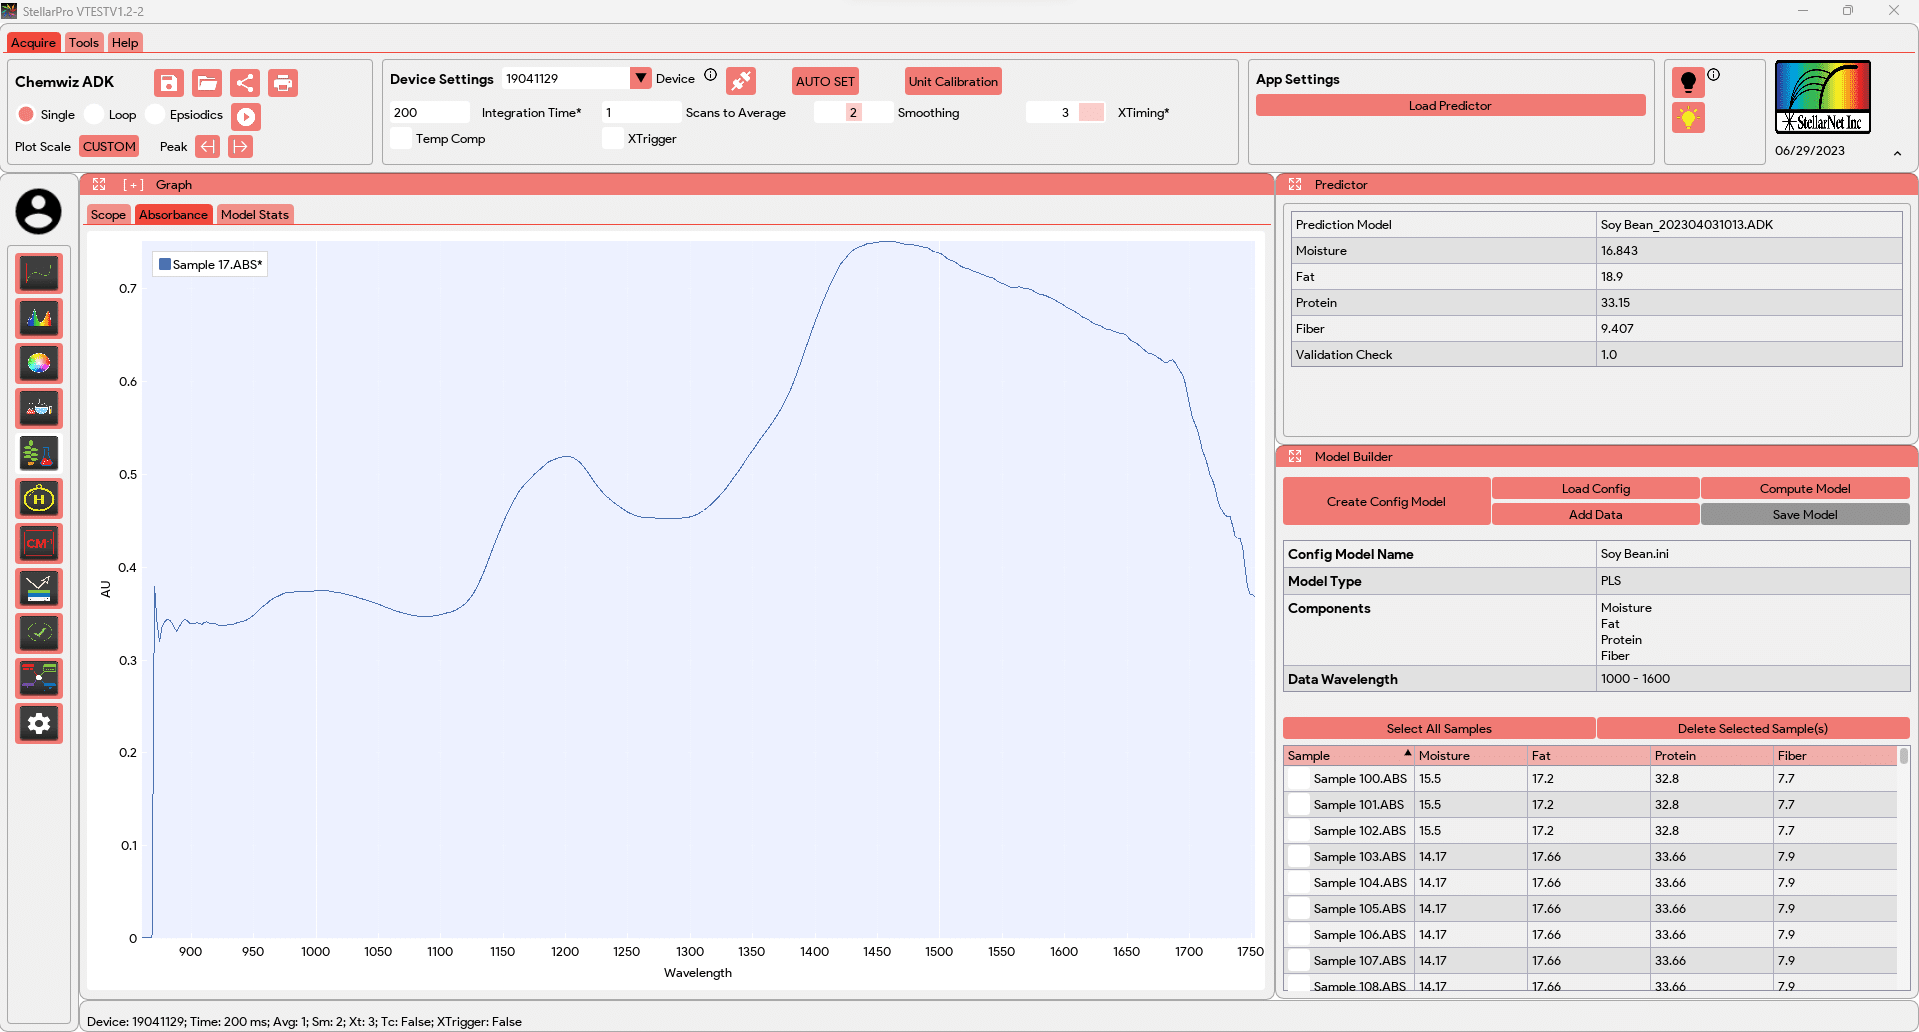
The Chemwiz ADK App utilizes spectrometric absorbance data to predict and classify the composition of a sample using advanced techniques such as Partial Least Squares (PLS) and Nearest Neighbor for classification. It employs multivariate analysis methods to analyze the complex absorbance patterns and extract meaningful information about the sample’s composition.
The app offers a built-in predictor that allows users to input absorbance data and obtain predictions for the composition of the sample. This provides a quick and convenient way to obtain insights about the sample without the need for extensive data analysis.
Additionally, the app includes an advanced model builder, which enables users to create customized models using their own data. The model builder provides a comprehensive set of tools and algorithms to optimize and refine the predictive models based on specific requirements and applications.
App Settings
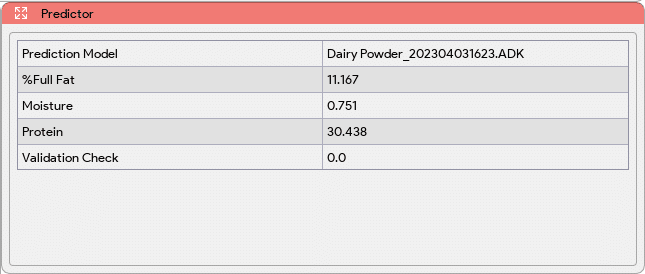
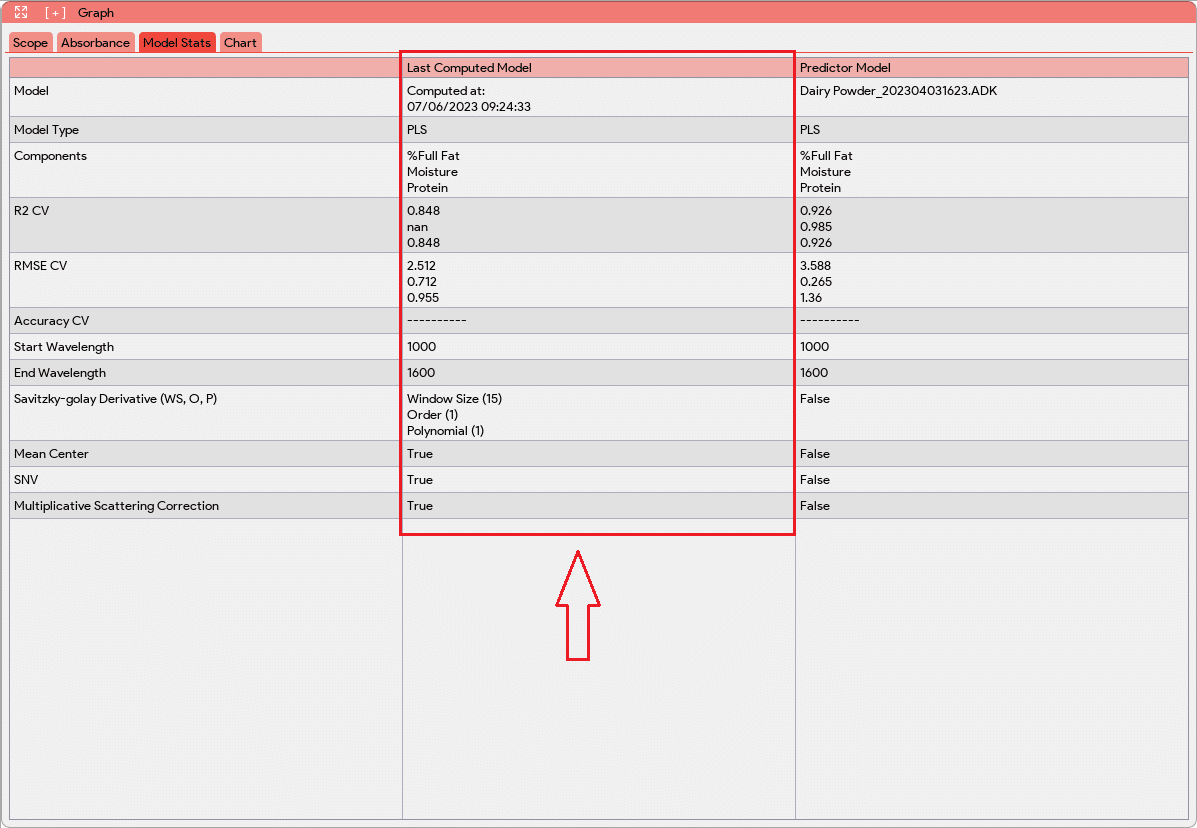
![]() The App Setting in the Chemwiz ADK App includes a “Load Predictor” button, which allows users to load a pre-built model (ADK/ADKc files) into the predictor. By clicking the “Load Predictor” button and selecting the appropriate model file, users can load the trained model into the predictor. This model contains all the necessary parameters, weights, biases, and regression coefficients that were previously trained and optimized using absorbance data. Once the model is loaded, it becomes ready to make predictions on the classification or perform quantitative analysis of the composition of a sample based on the measured absorbance data. The details of the loaded predictor model can be viewed in the “Model Stats” tab in the Graph window and in the Predictor window.
The App Setting in the Chemwiz ADK App includes a “Load Predictor” button, which allows users to load a pre-built model (ADK/ADKc files) into the predictor. By clicking the “Load Predictor” button and selecting the appropriate model file, users can load the trained model into the predictor. This model contains all the necessary parameters, weights, biases, and regression coefficients that were previously trained and optimized using absorbance data. Once the model is loaded, it becomes ready to make predictions on the classification or perform quantitative analysis of the composition of a sample based on the measured absorbance data. The details of the loaded predictor model can be viewed in the “Model Stats” tab in the Graph window and in the Predictor window.
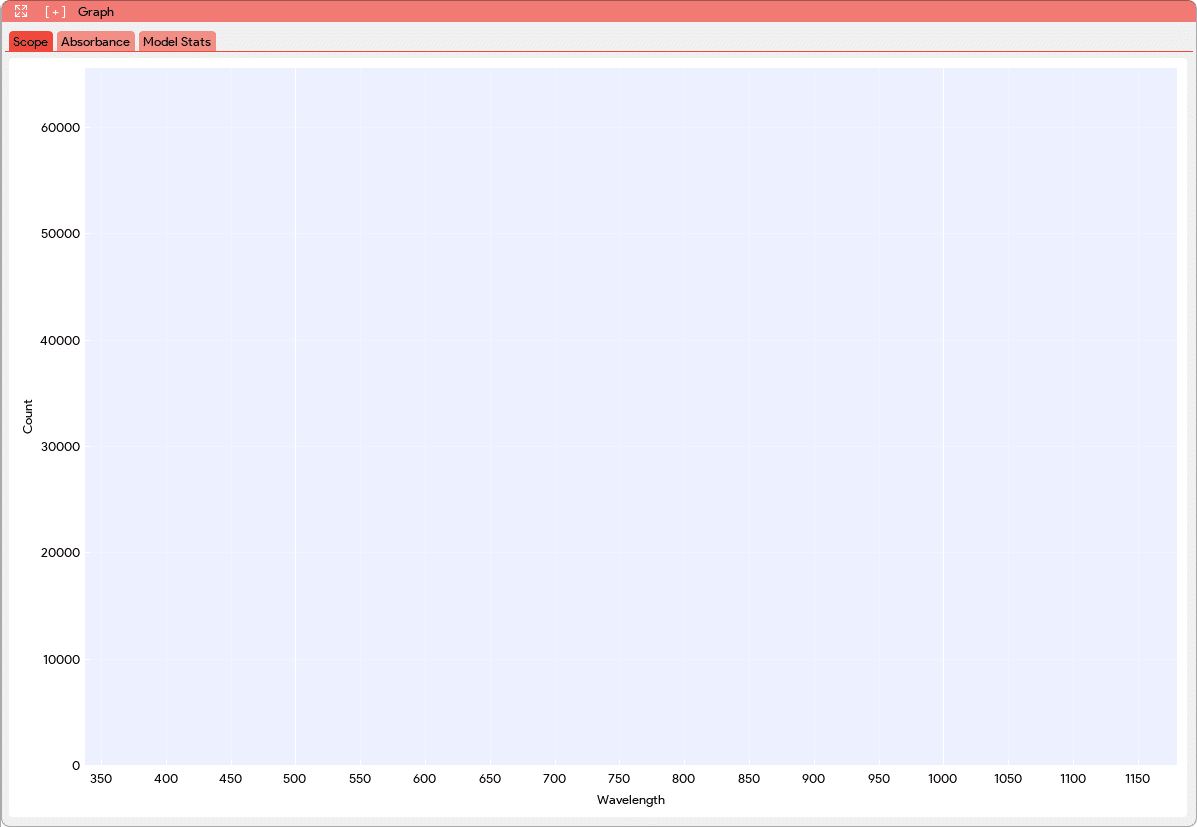
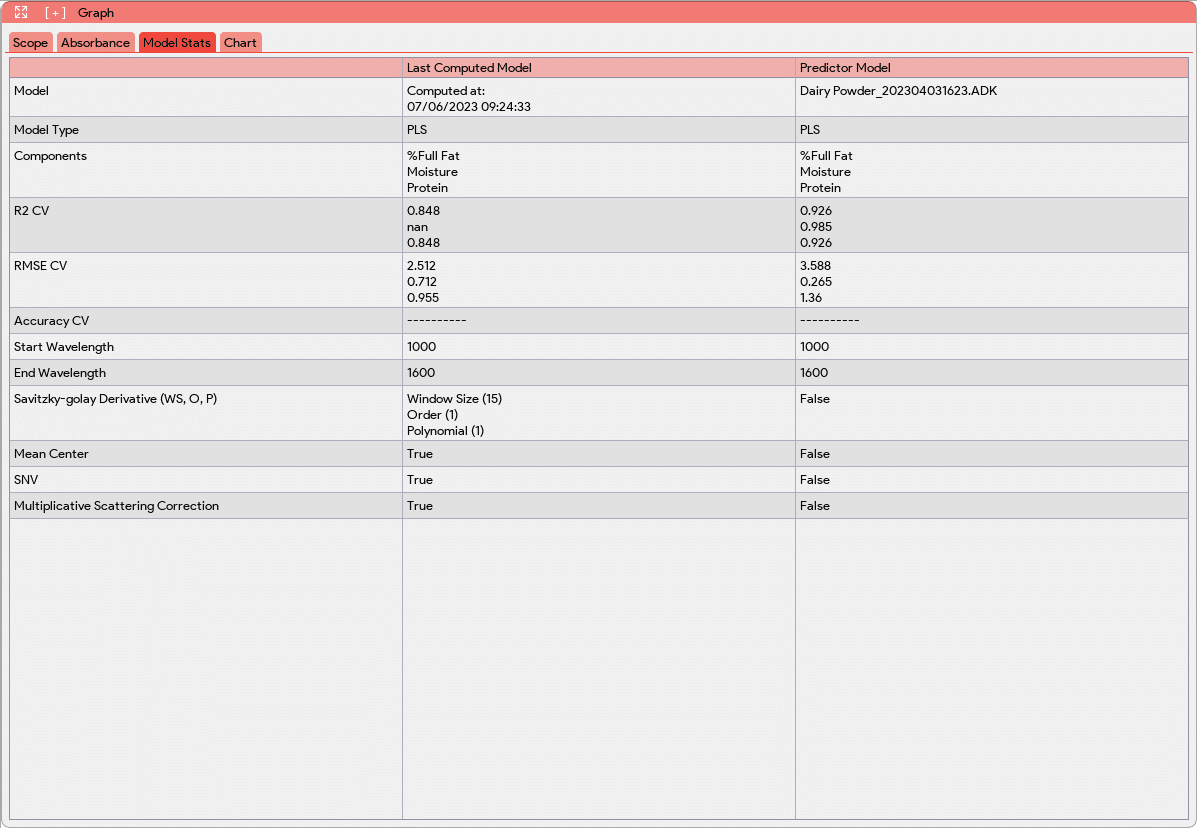
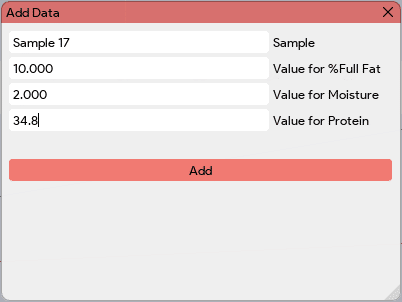
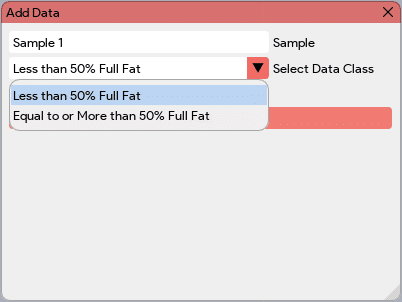
WindowsThe Graph window in the Chemwiz ADK App includes a Scope plot that provides real-time visualization of the spectrometric absorbance data. It also features an Absorbance plot, which displays the absorbance values across the specified wavelengths. In addition to the graphs, the Graph window includes a Model Stats tab. This tab presents various information about the loaded model, including the model name, type, and the names of its components. It also provides evaluation metrics such as R2 (coefficient of determination) and RMSE (root mean square error), which assess the performance of the model. The Model Stats tab further presents the processing steps applied to the absorbance data during the modeling process. This gives users insights into the data pre-processing techniques employed to optimize the model’s performance. The Model Stats tab also allows the users to compare the loaded model with pre-existing models. This comparison assists users in making informed decisions about which model to use in production or for further analysis. The Predictor window continuously monitors and processes the incoming spectrometric data to perform predictions using the loaded model. This real-time analysis allows for efficient and timely prediction of the composition or concentration of the components in the sample. The Model Builder window in the Chemwiz ADK App offers a comprehensive set of tools and options to create either a Partial Least Squares (PLS) regression model or a classification model using absorbance data and known component concentration. Within the Model Builder window, users can access various functionalities and settings to build their models:
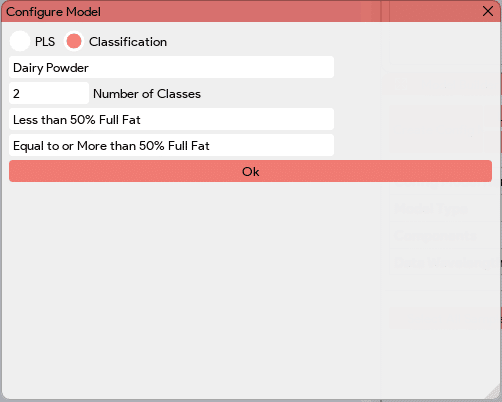
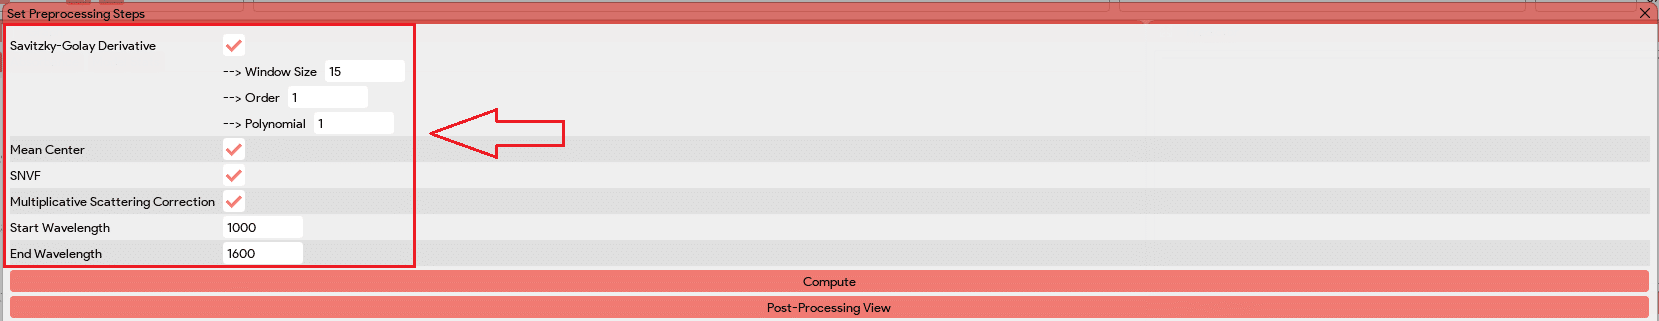
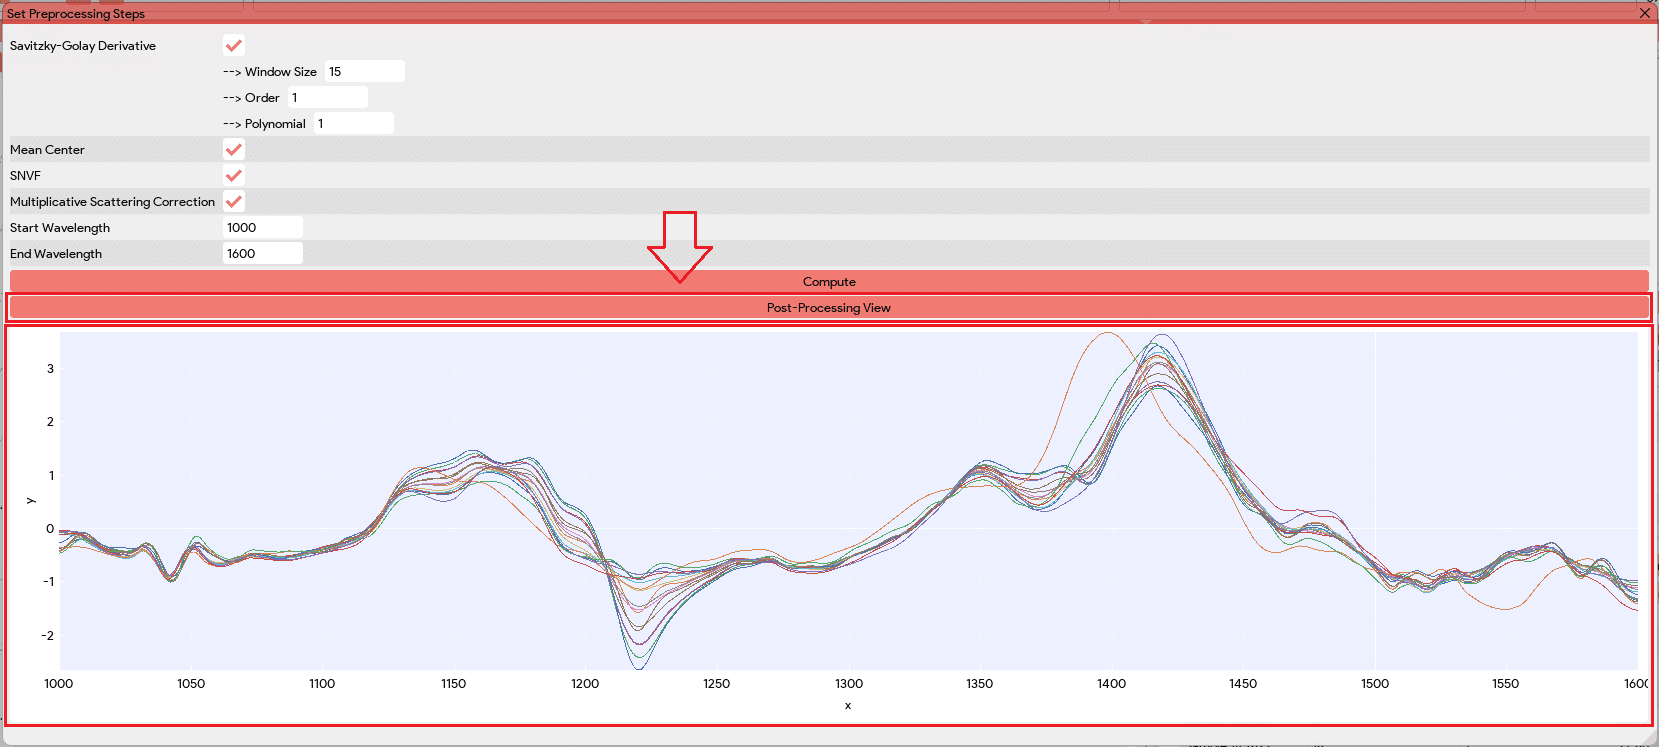
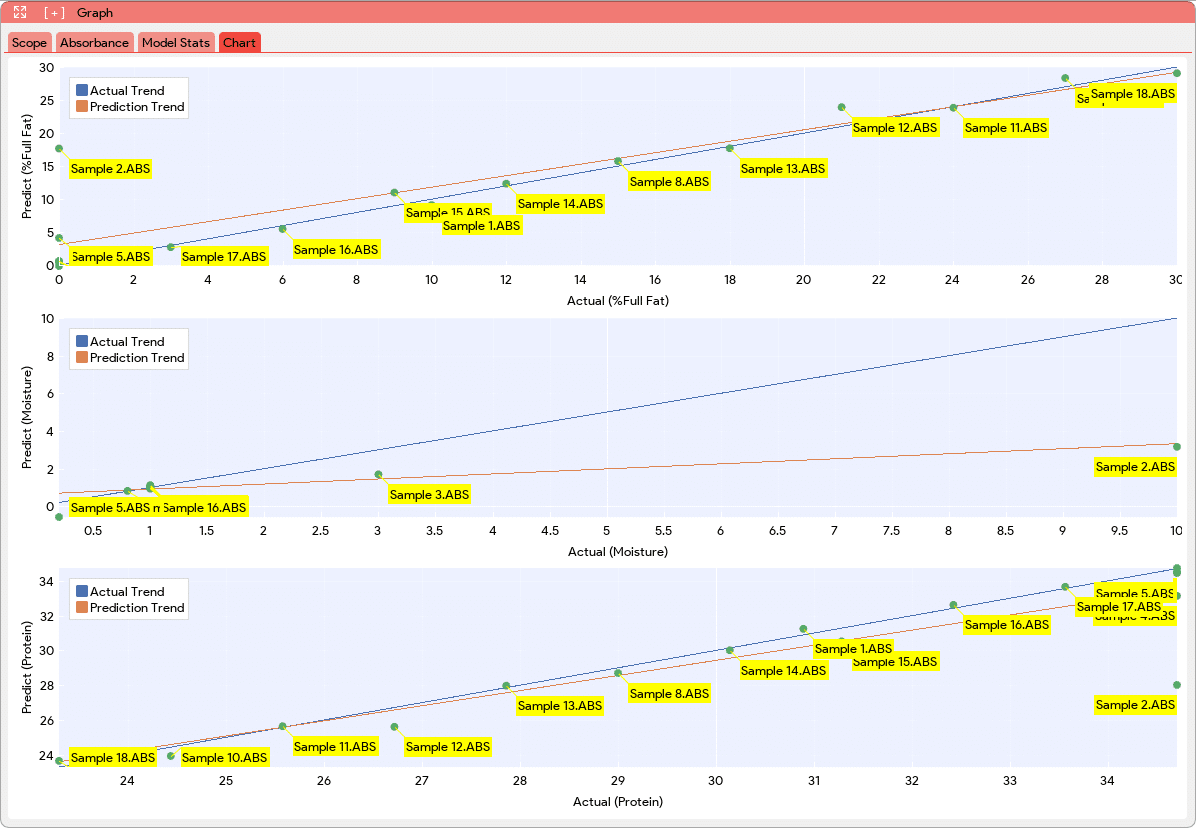
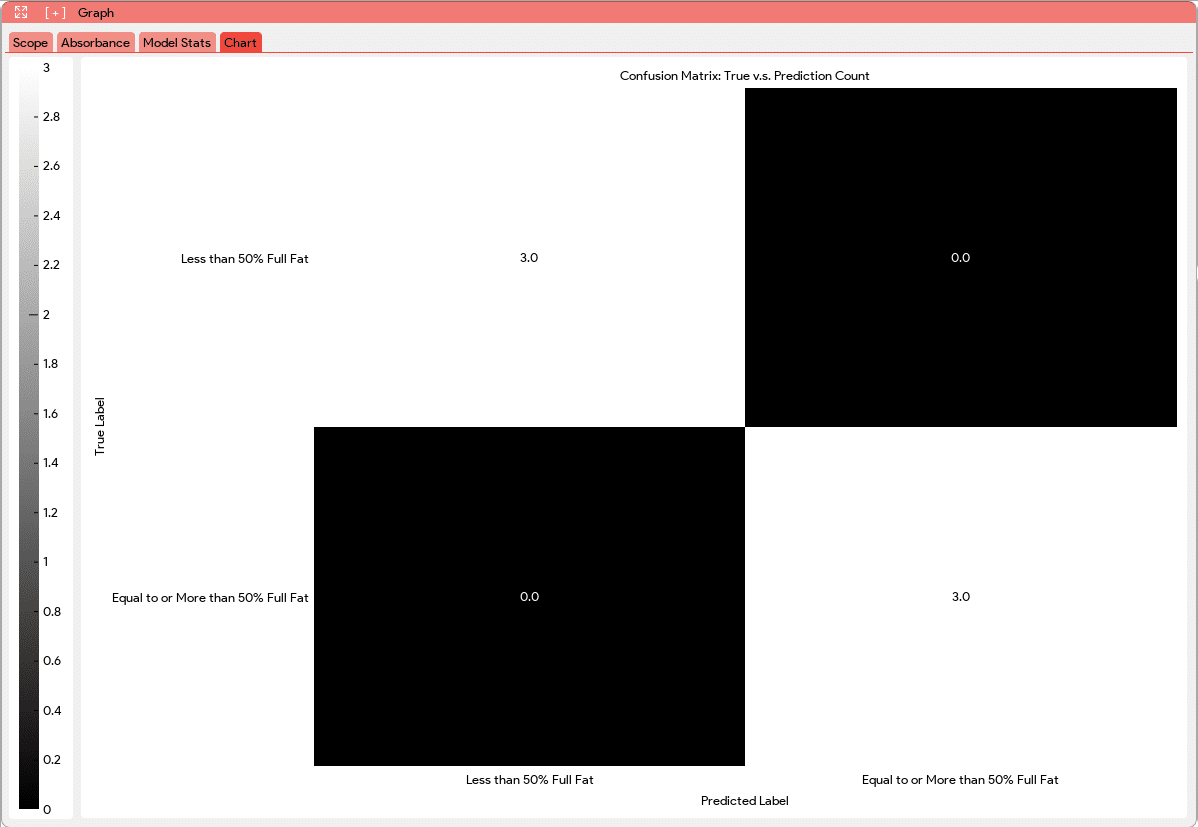
Upon selecting the desired preprocessing steps, users have the option “Post-Processing View” to visualize the data after these steps are applied. This allows them to assess the impact of the preprocessing techniques on the data and make informed decisions about the suitability of the chosen steps. When the “Compute Model” button is clicked, the application applies the selected preprocessing steps to the data and creates a model based on the configuration specified earlier. The model’s evaluation metrics, such as R2 (coefficient of determination) and RMSE (root mean square error), are then populated in the Model Stats tab. These metrics provide valuable insights into the performance and predictive capabilities of the model, allowing users to evaluate and assess its effectiveness. Additionally, a new tab “Chart” will be added to the Graph Window. This new tab will provide visual representations of the model’s performance. In this Chart tab, the PLS model will generate plots that compare the actual values versus the predictions for each component using cross-validation data. These plots allow users to assess how well the model predicts the component concentrations or classifications. For classification models, the Chart tab will display a confusion matrix. The confusion matrix displays the classification results, showing the number of samples correctly classified and misclassified for each class. This matrix provides a comprehensive overview of the model’s accuracy and performance in classifying different samples.
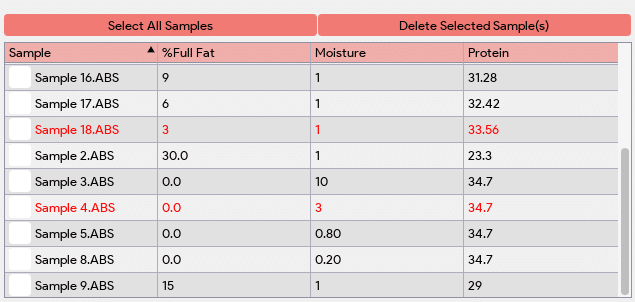
After the computation process, the application performs outlier detection using residual and leverage outlier detection methods. Outliers are data points that deviate significantly from the expected pattern or trend. The application will automatically detect these outliers and highlight them red in the table, making them easily identifiable. The identification of outliers allows users to assess the impact of these data points on the model’s performance and reliability. Depending on the user’s discretion and the specific requirements of the model, they can choose to delete the outlier data points or consider retaking those measurements to ensure a robust model building process.
|
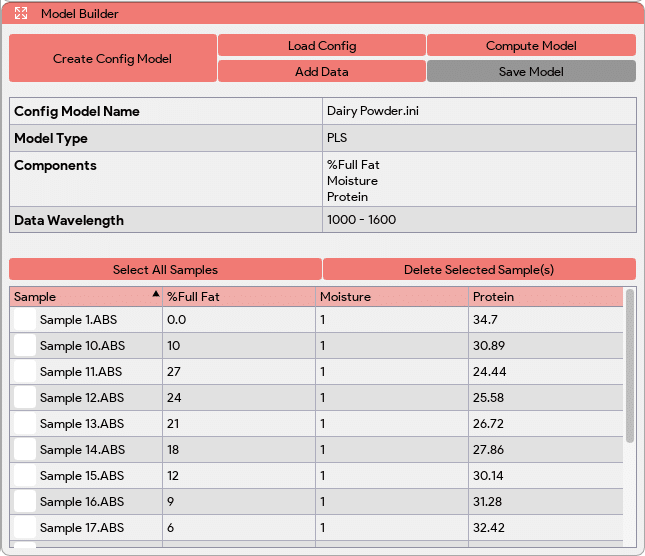
 The “Create Config Model” button in the Model Builder window allows users to generate a folder (located in the “StellarPro Data” folder) and a configuration file (.ini) for the model. The configuration file contains essential information such as the model type (quantitative/qualitative), model name, number of components/classes, and their names. It is used to store details about the model before it is built, serving as a reference for subsequent steps in the model building process.
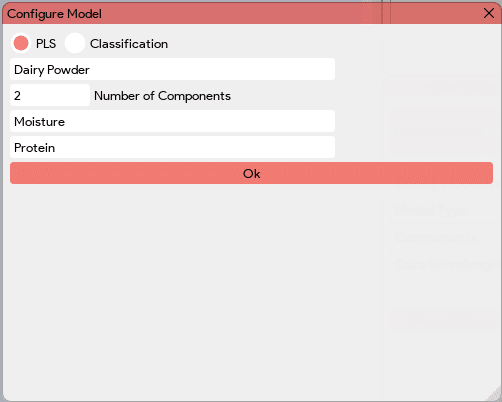
StellarNet Spectrometer Instrumentation
StellarNet’s wide range of miniature spectrometer instrumentation and complete line of light sources, optical fibers, and sampling accessories combine with the new ChemWiz® Analyzer Development Kit (ADK) to allow end user’s to build their own custom analyzers.

ChemWiz-ADK™ & ChemWiz-ADK™-Case
- Handheld or mountable/modular ChemWiz-ADK™ is excellent for sample analysis within production environments, inspection at receiving or trading locations, and/or quality control laboratories.
- Great for technicians and routine daily inspections
- Easily analyze composition of solids, liquids, powders, and pellets
- Instantaneous, real-time quality results
- Amazingly powerful yet simplistic ChemWiz-ADK PRO App interface
- Advanced “admin mode” and basic “technician mode” option
- Session reports with data logging
- Little to no sample preparation required
- Affordable and accurate solution most quality inspections
- Can be customized for your samples or branded for your company
- Rugged ChemWiz-ADK-Case upgrade option

ChemWiz Analyzer Applications
Full spectrum chemometric analysis for identification of multiple component parameters has many applications. Currently the Food and Agricultural Industries have developed many methods for quality control and safety assurance. UV-VIS and NIR spectroscopy serve as a means for rapid non-contact analysis of samples, revolutionizing our current standards for product control. Other industries such as the polymer and plastic, chemical and industrial, pharmaceutical & and dietary supplement industries find useful applications with UV-VIS-NIR spectroscopy.
This section of the website serves to provide useful resources for applications requiring chemometrics models and UV-VIS & NIR spectroscopy to determine various parameters of choice. Although other hardware and software may have been used to accomplish the measurements in the literature cited below, StellarNet spectroscopy instrumentation and development software may be used for similar applications. StellarNet engineers are available to suggest configurations; however, StellarNet is not a consultant firm or R&D facility. Please refer to the references for further information and/or guidance to determine feasibility of your project. Below the parameters of choice are black and the references are listed below in blue and pink.
Food and Agriculture
 From compositional analysis to process optimization and quality control, our robust NIR systems will allow you to determine multiple parameters simultaneously. Incoming raw materials are easily measured to verify they meet all specifications certified by the vendor and batch ratios can be monitored for uniformity, ensuring a quality final product, avoid over-processing, and much more.
Forage & Feedstuffs
Alfalfa – Barley straw – Bromegrass – Corn – Timothy – Hays
1. Abrams, SM., J.S Shenk, and H.W. Harpster. 1988. Potential of near IR reflectance spectroscopy for analysis of silage composition. J. Dairy Sci. 71:1955-1959.
2. Agung, P., K. Mitsunori, N. Takehiro, T. Fuminori, A. Akira, and H. Tatsuo. 1997. Two methods of near infrared reflectance spectroscopy for digestibility and energy value feeds. Anim. Sci. Technol. 67:851-861
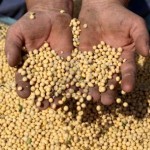
3. Pazdernik, D.L., A.S. Killam, and J.H. Orf. 1997. Analysis of amino and fatty acid composition in soybean seed. Agron. J. 89:679-685
Fruits and Vegetables
|
Sample |
Parameter |
| Apple | acid11, bruised tissue, dry matter, firmness, fructose, glucose11, moisture12 , pH, solube solids, sugar12 |
| Cherry | firmness13, pit detection, soluble solids |
| Date | moisture, soluble solids |
| Orange | citric acid, malic acid, fructose, glucose, purity |
| Papaya | carotenoids, chlorophyll, maturity, soluble soids |
| Potato | bruised tissue, discoloration, maturity, sorbitol, sucrose |
| Tomato | acidity, maturity, soluble solids |
11. Budiastra, I.W., Y. Ikeda, and T. Nishizu. 1998. Optical Methods for quality evaluation of fruits. Part 2. Prediction of individual sugars and malic acid concentrations of apples and mangoes by the developed NIR reflectance system. J. Jpn. Soc. Agric. Machin.60:117-127
12. Murakami, M., J Himoto, and K. Itoh. 1994. Analysis of apple quality by near-infrared reflectance spectroscopy. J. Fac. Agric. Hokkaido Univ. Jpn. 66:51-61
13 Lu, R. 2001a. Predicting firmness and sugar content of sweet cherries using near-infrared diffuse reflectance spectroscopy. Trans. ASAE 44:1265-1271
Small Grain Crops
 Like forages and feedstuffs, small grain crops and cereals, especially wheat, have also been examined extensively. Common analytes or parameters have been amino acids, ash, glucosamine, moisture, protein, and whole grain analysis.
Barley – Rice7 – Wheat
4. American Society of Brewing Chemists. 1998. Report of subcommittee on protein and moisture in whole-grain barley by near infrared spectroscopy. J. Am. Soc. Brew. Chem. 56:189-194.
5. Delwiche, S.R. and W.R. Hruschka. 2000. Protein content of bulk wheat from near infrared reflectance of individual kernels. Cereal Chem. 77:86-88.
7. Iwamoto, M., T. Suzuki, N. Kongseree, J. Uozumi, and O. Inatsu. 1986. Analysis of protein and amino acid contents in rice flour by near-infrared spectroscopy. Nippon Shokuhin kogyo Gakkaishi 33:848-853.
Beverages and Brewing
14. Buchanan, B.R., D.E. Honigs, C.J. Lee, and Roth. 1988. Detection of ethanol in wines using optical-fiber measurements and near infrared analysis. Appl. Spectrosc.42(6):1106-1111.
15. Coventry, A.G., and M.J. Hunston. 1984. Applications of near-infrared spectroscopy to the analysis of beer samples. Cereal Foods World 29:715, 717-718.
Meats
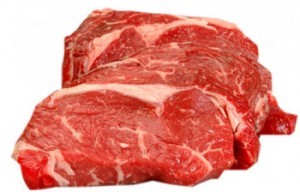 Meats, poultry, and fish are also monitored by NIRS. Certain parameters such as fat, moisture, and protein content are some of the most important. Ground and frozen meats can be analyzed for quality and control and even factors such as meat tenderness can be acquired14!
Pork – Chicken – Turkey – Beef – Lamb – Fish – Ground Meats – Frozen
14. Hildrum, K.I., B.N. Nilsen, M. Mielnik, and T. Naes. 1994. Prediction of sensory characteristics of beef by near infrared spectroscopy. Meat sci. 38:67-80.
15. Windham, W.R., and W.H. Morrison. 1998. Prediction of fatty acid content in beef neck lean by near infrared reflectance analysis. J. Near Infrared Spectrosc. 6:229-234.
Dairy and Eggs Products
 Our complete solution of combined hardware and software can help you to improve the productivity and efficiency of many dairy processing applications. Milk is the first food for humans and mammals alike, and therefore quality control and analysis of Dairy products is of utmost importance. This is all in an effort to help you reduce costs while ultimately improving quality by monitoring parameters such as protein, fat, lactose, and much more. Non-destructive sample testing ensures fast and low cost analysis whenever you need it.
Milk – Milk Powder – Cheese – Cheese Powders – Butter – Whey
16. Barabassy, S., and K. Kaffka. 1993. The application possibilities of the near infrared technique in the non destructive investigation of mixed milk powder products. J. Food Phys. 57:39-48.
17. Frank, J.F. and G.S. Birth. 1982. Application of near infrared reflectance spectroscopy to cheese analysis. J. Dairy Sci. 65:1110-1116.
Coffee, Tea, Tobacco, & Related Products
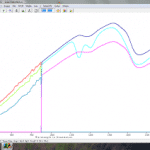
Dual DSR- Reflectance Spectra of Folgers Caffeinated, Decaffeinated, & Half-Caffeinated coffees
Commercial coffee is mainly made up of two main blends, Arabica and Robusta. Main distinguishing absorptions can be found from water content (1466 and 1962nm) and lipids (1209, 2308, and 2346nm)8. NIRS can be used for classification as well as blending. Also, caffeine and dry matter content can be determined. Green9, black, and oolong tea can be analyzed for different different polyphenols, caffeine, and amino acids by using various wavelengths in the NIR thus allowing rapid determination of factors relating to tea taste and health parameters. Since the 70’s NIRS has been used to predict the total reducing sugar content in tobacco and total alkaloids providing valuable information about the mildness and aroma of the smoke10.
8. Downey, G., and J. Boussion. 1996. Authentication of coffee bean variety by near-infrared reflectance spectroscopy of dried extract. J. Sci. Food Agric. 71:41-49.
9. Ikegaya, K.,1990. Determination of chemical constituents in processed green tea by near infrared analysis. JARQ 24:49-53.
10. Hamid, A., W.F. McClure, and W.W. Weeks. 1978. Rapid spectrophotometric analysis of chemical composition of tobacco. Part 2. Total alkaloids. Beitr. Tabakforsch. Int. 9:267-274.
Fats and Oils
|
Sample |
Parameter |
| Soybean oil | acid values, iodine, cis/trans FAs |
| Olive oil18 | Free Fatty Acids, total polyphenols, K270, 235, 225 , moisture, a |
| Sunflower | linoleic, palmitic, palmitoleic, stearic, & oleic acids |
| Sesame oil | linoleic, palmitic, palmitoleic, stearic, & oleic acids |
| Butter | moisture, fat, NaCl, nonfat solids, purity |
18. Garrido, A., C. Cobo, J. Garicia-Olmo, M.T. Sanchez-Pineda, R. Alcala, J.M. Horcas, and A. Jimenez. 2000. The feasibility of near infrared spectroscopy for olive oil quality control. p. 867-871. InA.M.C. Davies and R. Giangiacomo (ed.) Near Infrared spectroscopy: Proceedings of the 9th Int. Conference. NIR publications, Chichester, UK.
19. Perez-Vich, B., L Velasco, and J.M. Fernandez-Martinez. 1998. Determination of seed oil content and fatty acid composition in sunflower through the analysis of intact seeds, husked seeds, meal, and oil by near infrared reflectance spectroscopy. J. Am. Oil Chem. Soc. 75:547-555.
Polymers and Plastics Production
Polymers and Plastics Production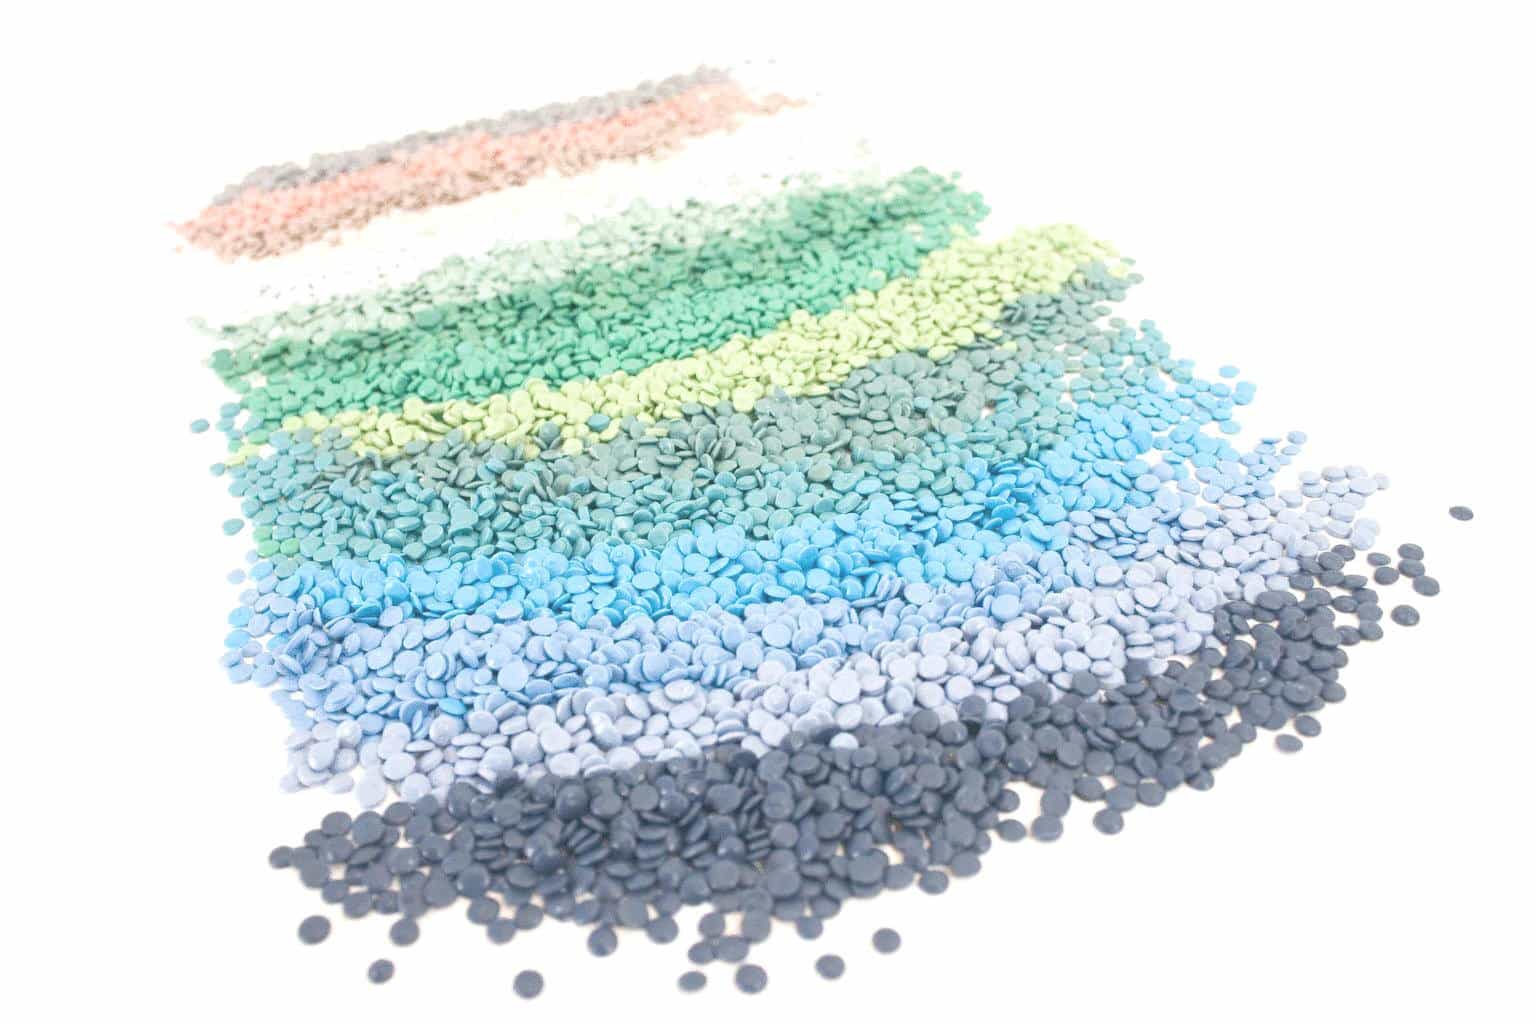
Technical Information Request

Earth Day 2024 with StellarNet: Planet vs. Plastics
Happy Earth Day! Today serves as a reminder of the importance of environmental conservation and sustainable practices to ensure the well-being of our planet for future generations. At StellarNet, we support sustainability and preserving Earth's precious ecosystems....