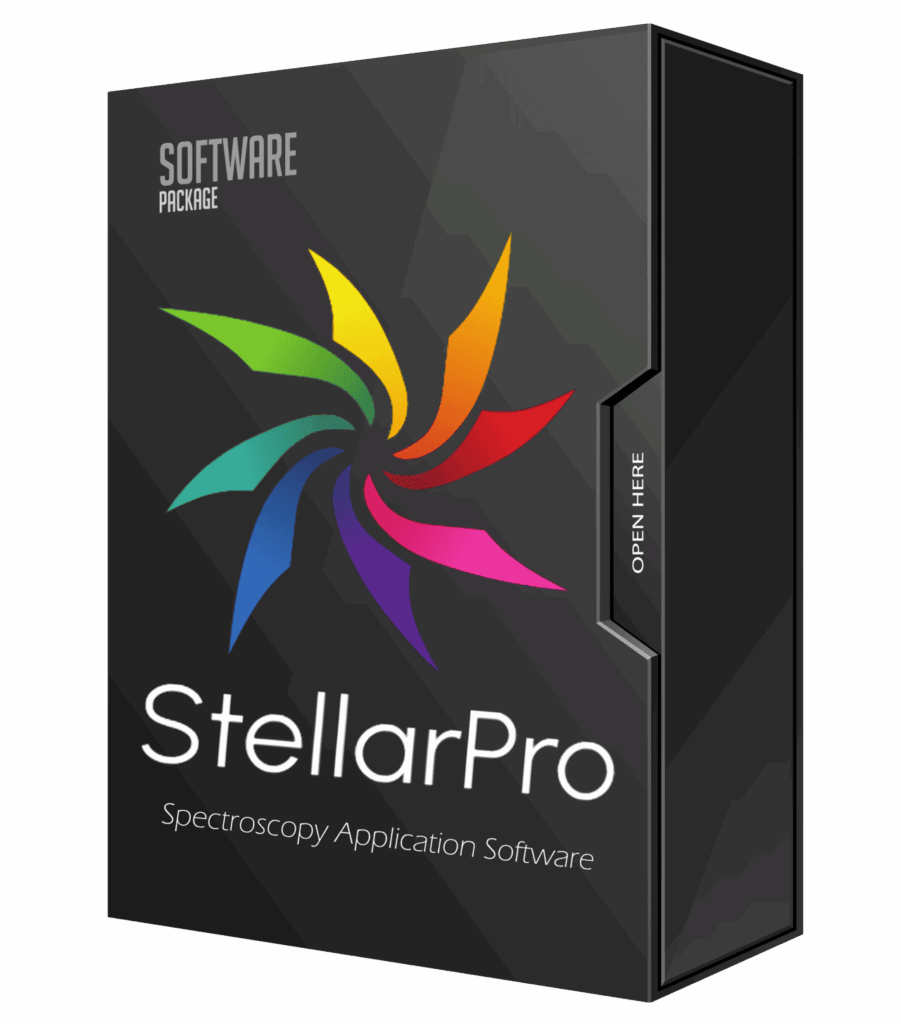
StellarPro Spectroscopy Application Software
Powerful Application Modules for Business and Research
StellarPro™
Spectroscopy Application Software
included FREE with every spectrometer
for Windows, Mac, & Linux


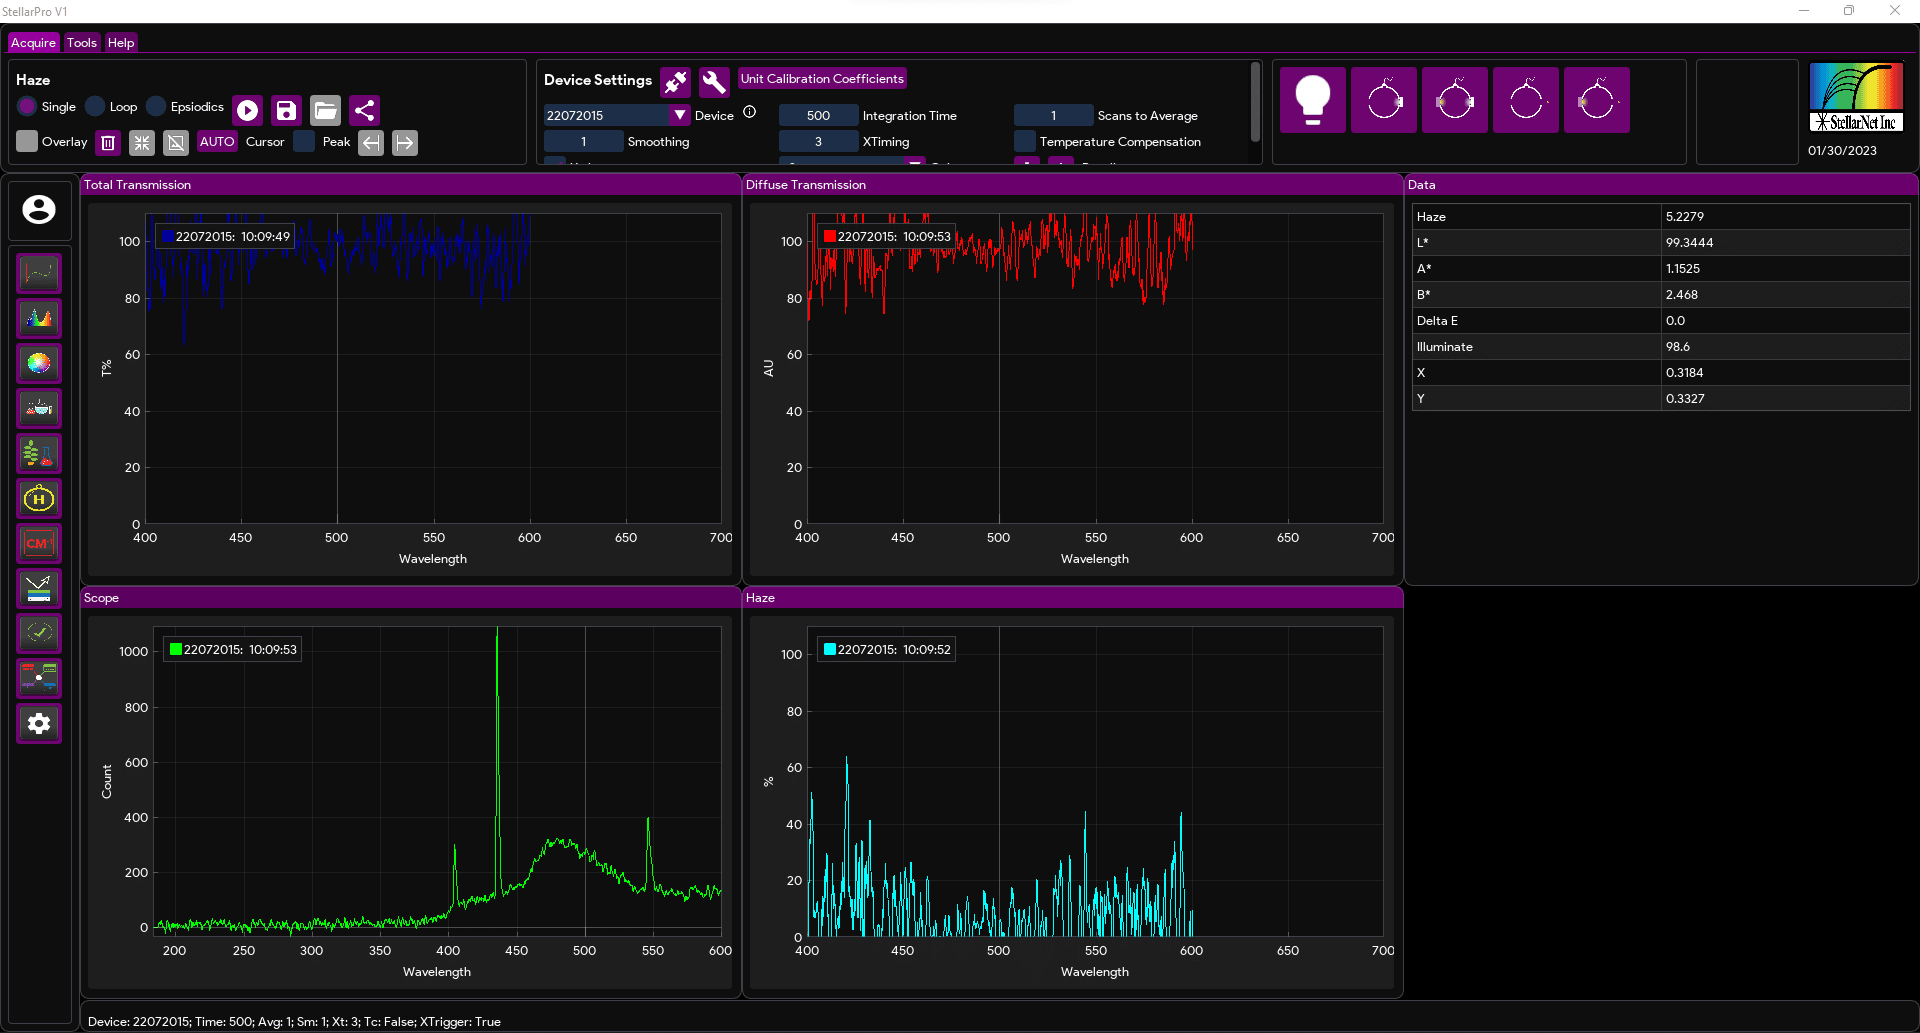


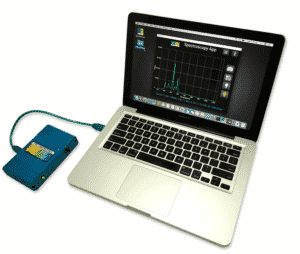
Our new StellarPro software also has integrated spectral preprocessing such as baseline subtraction, spike removal, and derivative view. Spectral matching, PLS Calibration model development, Classification algorithm, and run-time deployment are all included in this new software suite. StellarPro has user permission settings, login, and reporting to export all of your data in one place. Additional apps for Haze, Thin Film Analysis, and more are also included!
Application Modules
Radiometry 
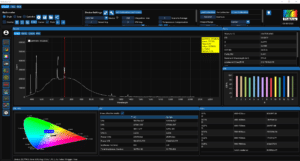
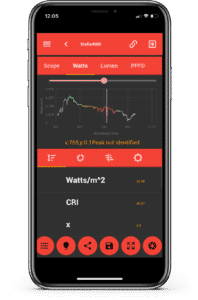
The Radiometer app offers comprehensive and detailed analysis for light sources, encompassing various aspects such as light power, quality, color, and temperature. It serves as a valuable tool for examining and understanding the characteristics of different light sources in a thorough manner.
Spectroscopy Knowledge Base for more info
Colorimetry
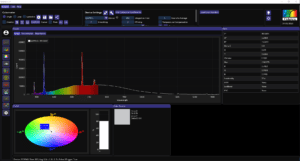
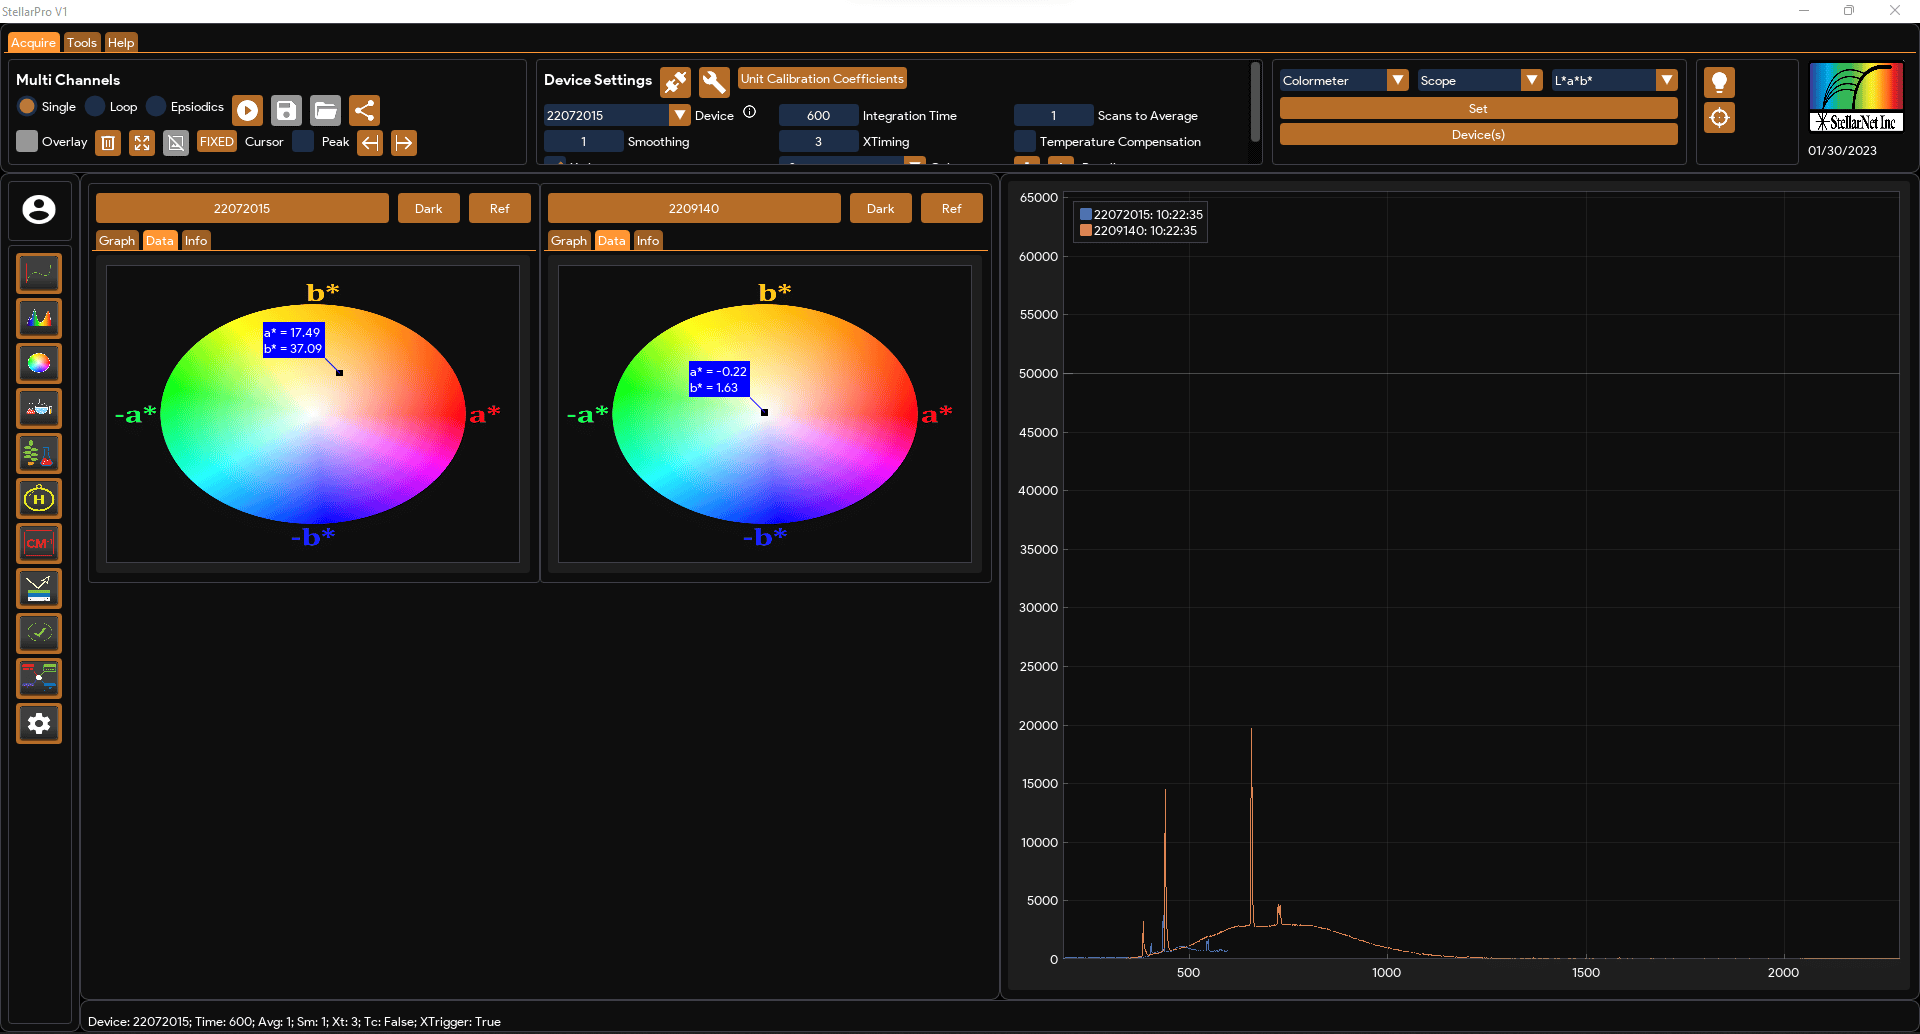
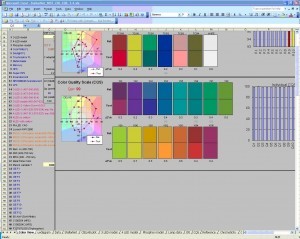
The app is specifically designed to analyze and evaluate the color of light reflected by objects such as solids, liquids, and powders. It employs a range of color analysis metrics and algorithms to provide comprehensive insights into the color properties of the sample.
Spectroscopy Knowledge Base for more info
Absorbance/Kinetics
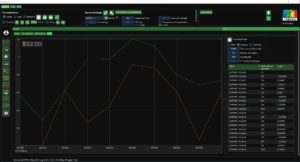
The app utilizes the absorbance of light at a specific wavelength to calculate the concentration of a chemical compound. It establishes a linear relationship between absorbance and concentration through calibration, enabling accurate concentration determination.
Spectroscopy Knowledge Base for more info
Chemometrics
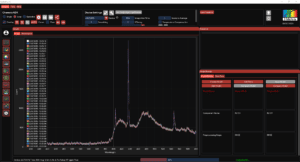
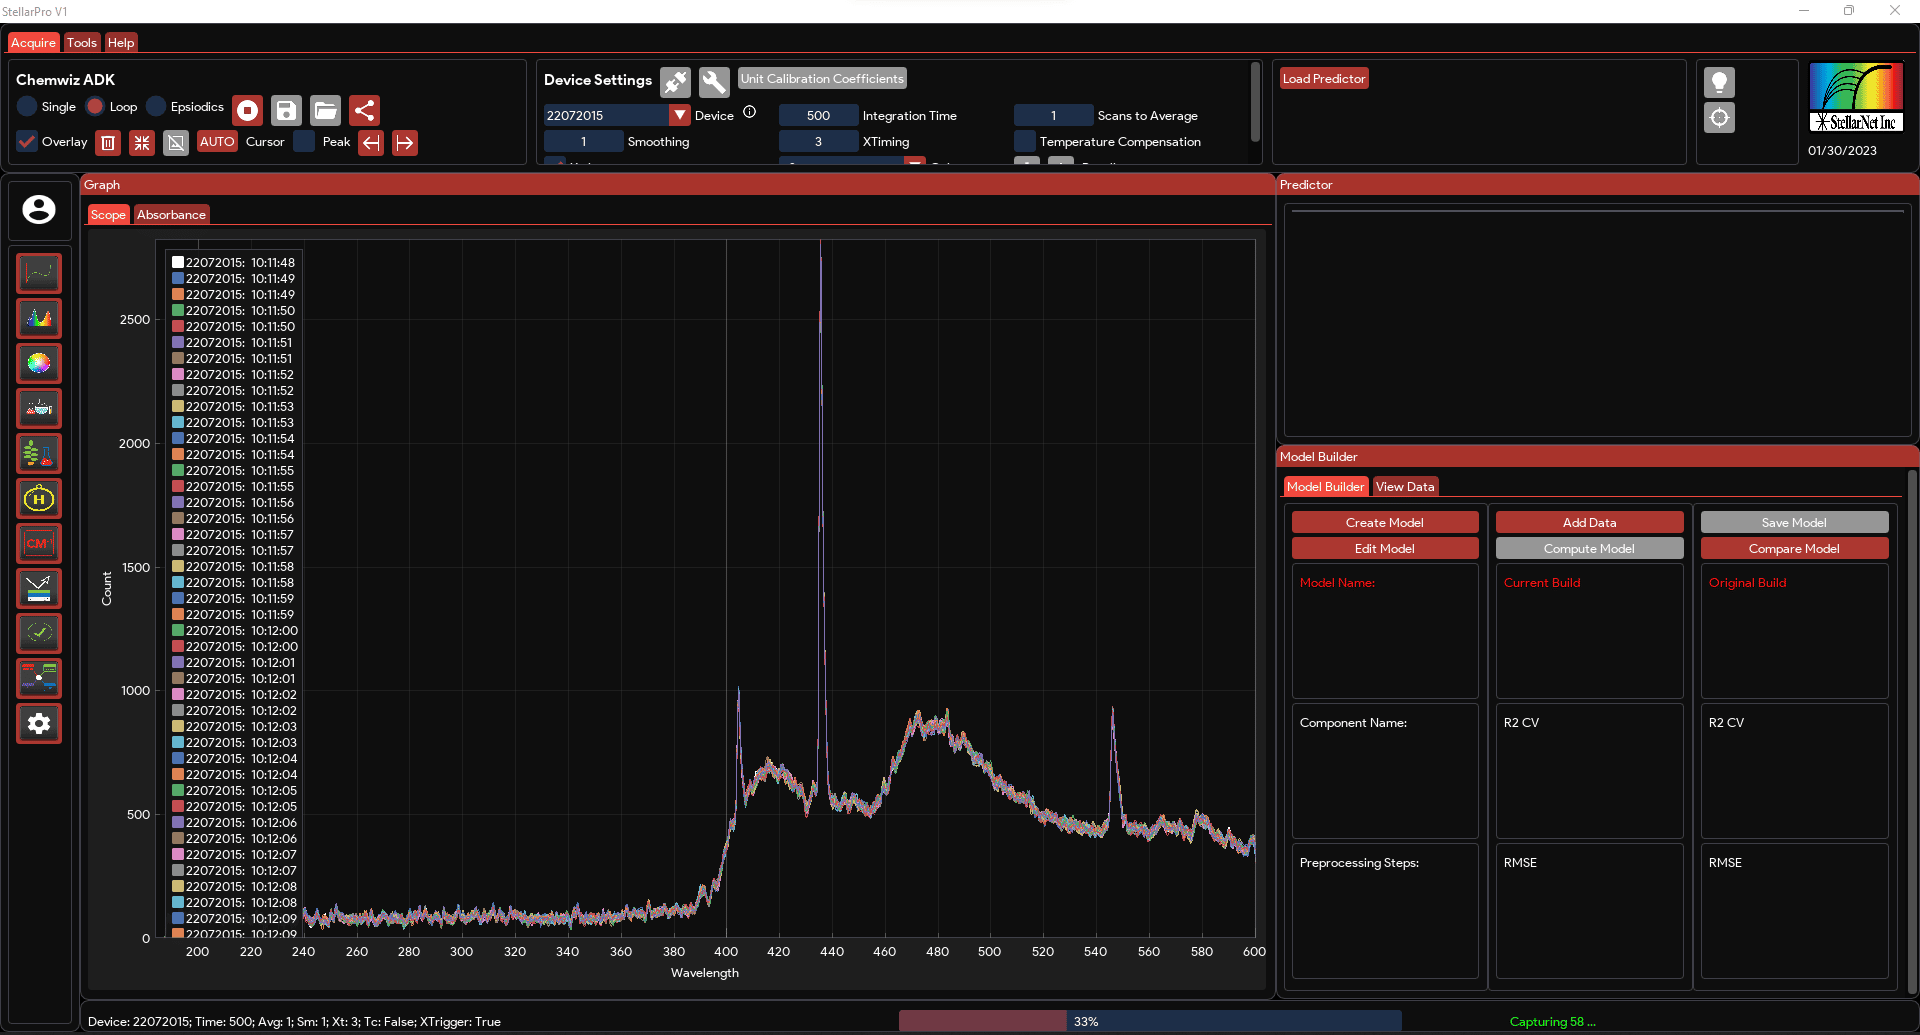
The Chemwiz ADK App utilizes spectrometric absorbance data to predict and classify the composition of a sample using advanced techniques such as Partial Least Squares (PLS) and Nearest Neighbor for classification. It employs multivariate analysis methods to analyze the complex absorbance patterns and extract meaningful information about the sample’s composition.
Spectroscopy Knowledge Base for more info
Spectral ID
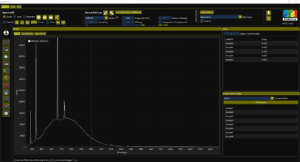
The Spectral ID app is designed to identify the best possible match for an unknown sample using either scope, absorbance, or transmission data. It utilizes a library of spectrometric data created by the user, which contains reference spectra of known samples.
Spectroscopy Knowledge Base for more info
Raman Mode
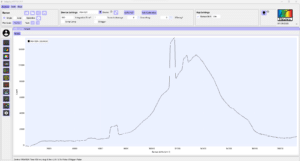
The Raman app is specifically designed to represent spectrometric data in Raman Shift space. Raman Shift is a term used in Raman spectroscopy to describe the shift in wavelength or frequency of light due to Raman scattering. The Raman app utilizes this concept to plot and analyze spectrometric data in the Raman Shift space.
Spectroscopy Knowledge Base for more info
Haze App

The Haze app is designed to measure the Haze percentage of transparent and translucent samples. It provides both Haze % and CIE Lab color values as outputs. The app utilizes two methods, namely Total Transmission and Diffuse Transmission, to determine the Haze value.
Spectroscopy Knowledge Base for more info
Thin Film App
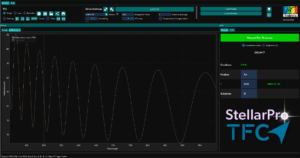
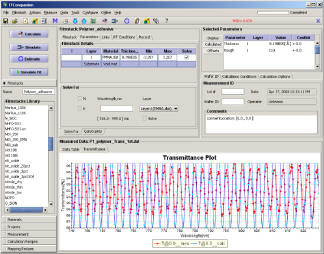
The Thin Film Measurement App is specifically designed to measure the thickness of a single-layer film using the transfer matrix method and reflectance data. This app utilizes the principles of thin film interference and the transfer matrix formalism to calculate the thickness of the film based on the changes in reflectance at different wavelengths.
Spectroscopy Knowledge Base for more info
Multi-Channels App
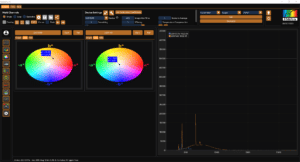
The Multichannel app offers users the flexibility to simultaneously use multiple spectrometers. This powerful functionality enables users to visualize different graphs and access application data for various purposes, including Radiometer, Colorimeter, Concentration, and Chemwiz ADK app. With the ability to utilize multiple spectrometers concurrently, users can efficiently analyze and monitor data across different applications and spectrometers.
Spectroscopy Knowledge Base for more info
Advanced Spectral Preprocessing
Baseline Removal: Eliminate unwanted systematic variations and noise, allowing the extraction of meaningful spectral information
- Polynomial: Fit and subtract a polynomial function from the spectral data
- Unispline: Utilizes a smoothing spline function to estimate and remove the baseline from spectral data
- ALS: Iteratively estimate and subtract a baseline from the spectral data
- arPLS: Iteratively estimates and removes the baseline from spectroscopic data by incorporating asymmetric reweighting and penalized least squares techniques
- drPLS: Combines penalized least squares with doubly regularization to enhance the removal of baseline distortions and noise from spectroscopic data
- Rubberhand: Robust and flexible baseline removal technique that utilizes a combination of curve fitting and iterative outlier rejection
Smoothing: Reduce noise and improve signal-to-noise ratio by averaging adjacent data points within a specified window
- Savgol: Uses polynomial fitting within a sliding window to reduce noise and enhance spectral data while preserving important features
- Whittaker: Applies a penalized least squares algorithm to effectively reduce noise, smooth spectral data
- Flat: Averaging adjacent data points within a fixed window size to reduce noise
- Hanning: Reduces spectral leakage and provides good frequency resolution by tapering the data points smoothly at the edges of the window
- Hamming: Improved sidelobe suppression, minimizing spectral leakage and enhancing frequency analysis in spectroscopy
- Bartlett: Triangular smoothing window that reduces spectral leakage by gradually tapering the data points from the center to the edges, suitable for applications where the spectrum is expected to be symmetric
- Blackman: Smoothing window with a more complex shape, featuring excellent sidelobe suppression and minimal spectral leakage, making it suitable for precise frequency analysis and peak detection in spectroscopy
Normalization: Scales spectral data for meaningful comparison and analysis, ensuring consistency and preserving spectral characteristics
- Intensity: Adjusts the spectral data to a consistent range, enhancing comparability and analysis by eliminating variations in overall intensity levels
- Minmax: Scales the spectral data to the range of 0 to 1
- Derivative: Enhance spectral features, identify peaks, and improve spectral resolution by quantifying the rate of change in intensity with respect to the wavelength or wave number, providing valuable information about the underlying chemical or physical processes in the sample
- Cosmic Rays/Spikes: Identification and elimination of sudden, isolated intensity spikes or cosmic ray events in the spectral data
User Login and Permissions
Data Reporting
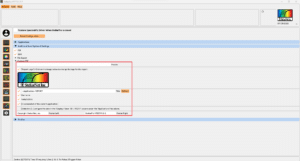
Header: Leave it empty for no header. Alternatively, use the “<Application>” text to display the selected application name.
Logo: Enable the checkbox to include a logo. You can replace the default logo by clicking on the image and selecting your desired logo.
Title: Enable the checkbox to include a title in the report. Once enabled, you can use the “<Application>” text to automatically insert the application name.
Username: Enable the checkbox to include the logged-in username in the report.
Today’s Date: Enable the checkbox to include the current date in the report.
Screenshot of the Current Application: Select this checkbox to capture and include a screenshot of the application.
Data Info: Customize the display and save options for the PDF by configuring the checkboxes in the “Display / Save PDF / MQTT” column under the “Applications” tab. The same settings will be applied to both the application window display and the MQTT publish.
Footer: The footer is not configurable and is reserved for StellarNet copyright and StellarPro version information.
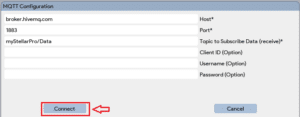
MQTT and Remote Connection
System Requirements
Windows 10 (64-bit) or newer
Other operating systems:
Ubuntu 20.04 (tested and supported)
macOS (tested on both Apple Silicon and Intel-based Macs)
RAM:
Minimum: 8 GB
Recommended: 16 GB or more (especially for large datasets
Other Software Options



Technical Information Request
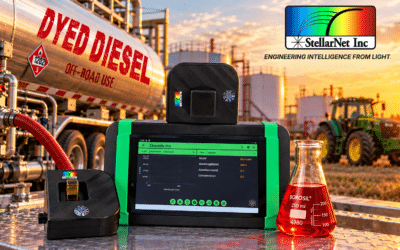
Red Dyed Diesel: How Portable Spectroscopy Measures Fuel Dye Concentration
Red dyed diesel—also known as red diesel, off-road diesel, dyed diesel, or farm diesel—has suddenly become a national topic. On October 5, 2026, President Donald Trump signed an executive order temporarily allowing dyed diesel to be sold for and used on U.S. highways...