The Multichannel app offers users the flexibility to simultaneously use multiple spectrometers. This powerful functionality enables users to visualize different graphs and access application data for various purposes, including Radiometer, Colorimeter, Concentration, and Chemwiz ADK app. With the ability to utilize multiple spectrometers concurrently, users can efficiently analyze and monitor data across different applications and spectrometers.
By utilizing the Multichannel app, users can harness the benefits of parallel data collection and analysis. They can connect and utilize multiple spectrometers simultaneously, allowing for synchronized data acquisition from different sources. This capability empowers users to compare and contrast data from multiple spectrometers, facilitating comprehensive analysis and accurate decision-making.
Furthermore, the Multichannel app enhances user experience by providing separate and independent graph visualization for each spectrometer. This means that users can simultaneously monitor and analyze data from different spectrometers, gaining valuable insights from various sources in real-time.
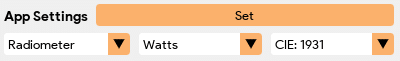
App Settings
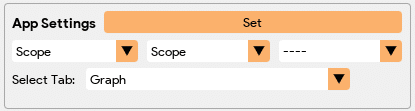
The Multichannel app allows users to select different application types and relevant plots for spectrum visualization and data analysis. It enables users to compare and visualize data in parallel from multiple spectrometers. The app has a high channel capacity, such as supporting up to 127 channels with StellarPro, allowing for scalability and flexibility in data acquisition and analysis. The Multichannel app empowers users to efficiently process data from multiple spectrometers simultaneously, enhancing their data analysis capabilities for various applications
Below are the applications supported in the Multi-Channels:
- Scope
- Radiometer
- Colorimeter
- Concentration (Prediction Only)
- Chemwiz ADK (Prediction Only)
 |
This customization feature allows users to tailor the Multichannel app according to their specific requirements and preferences. Users can choose the desired applications, configure the corresponding graphs, and specify the associated application data to be displayed for each spectrometer window.
Once selections are made, click on the “Set” button to confirm and apply the settings to all connected channels. |
| The “Select Tab” feature allows the user to control the tab selection for all channel windows. |
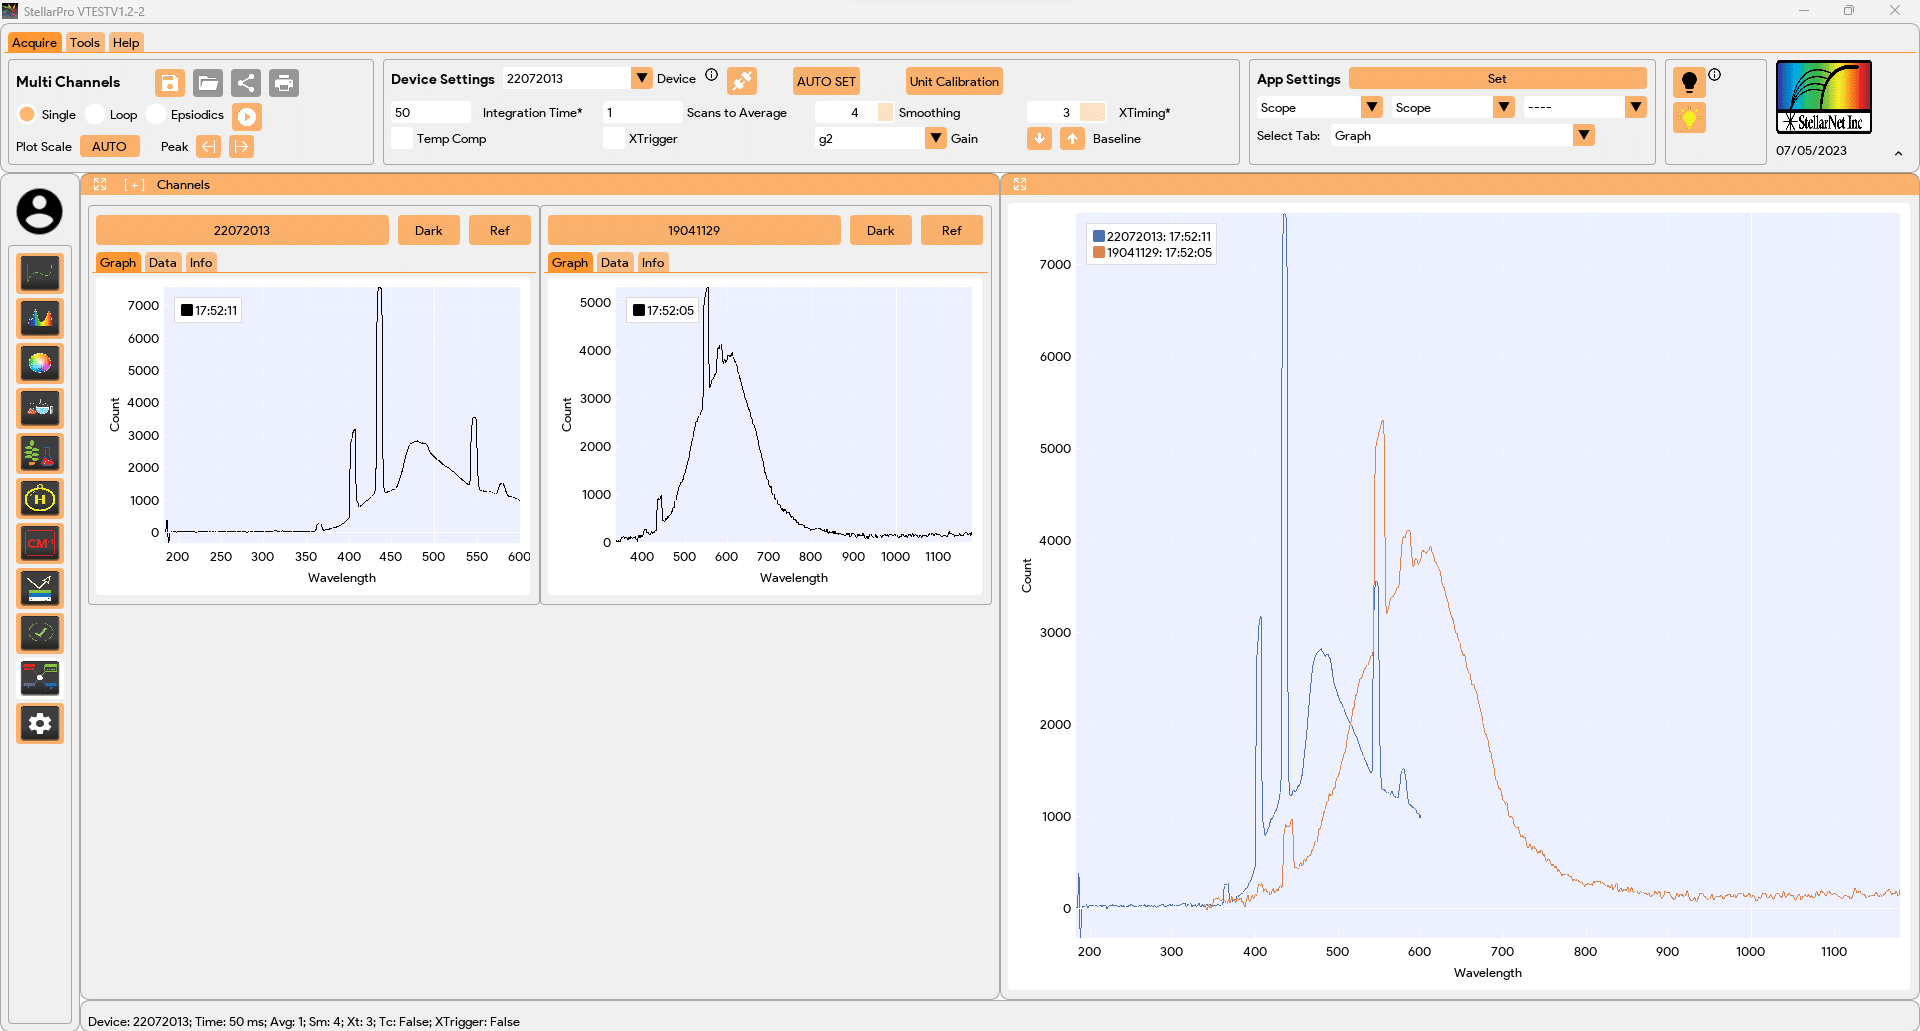
Windows
The Windows for Multichannel app is divided into two sections: Individual channel windows (left) and graph overlay window (right).
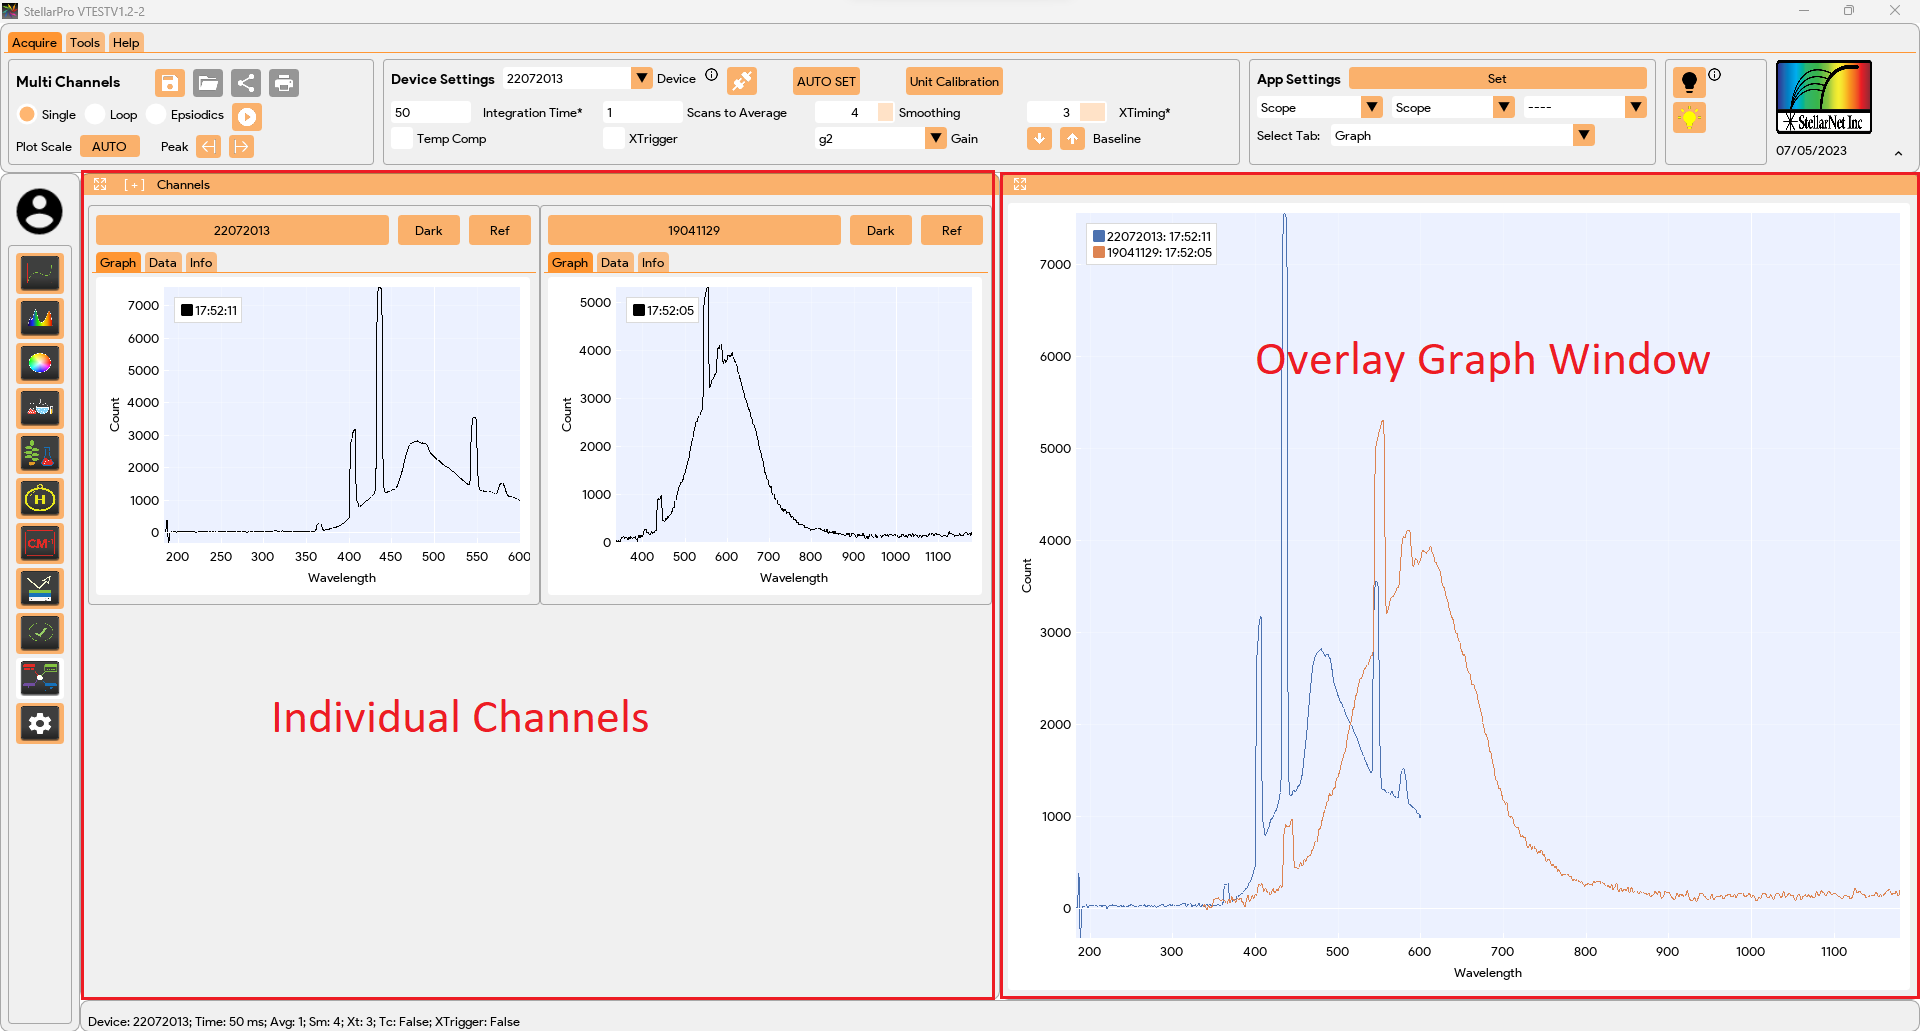
- On the right side, there is an overlay graph window based on the user selected graph. This window allows for a convenient comparison of spectra from multiple spectrometers on the same graph. By visually plotting the spectra from multiple channels on a single graph, users can easily compare and analyze the spectral data side by side. This feature simplifies the process of comparing spectra and gaining insights from multiple spectrometers simultaneously.
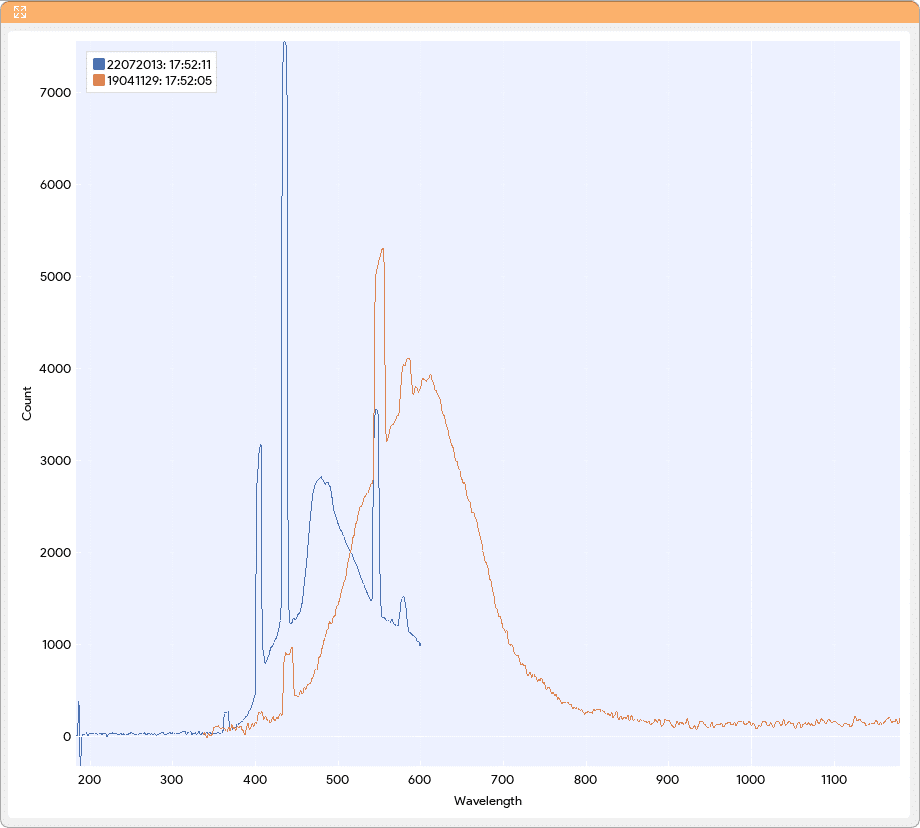
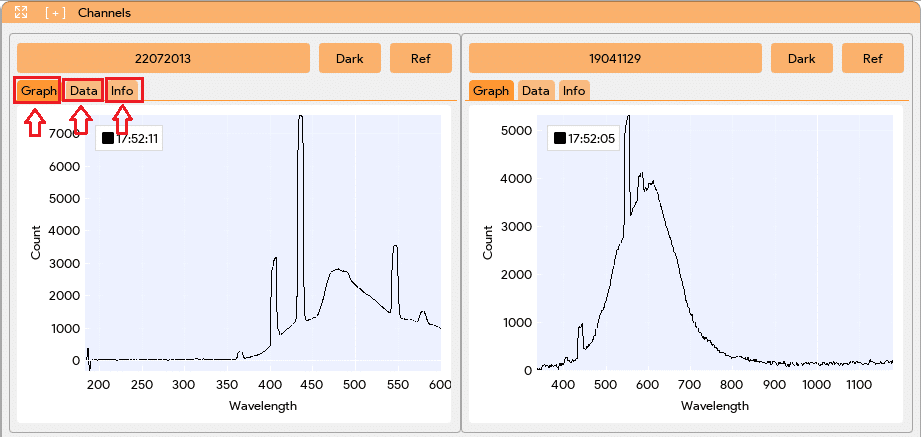
- On the left-hand side, there are individual windows for each connected spectrometer. The number of windows is dynamic and depends on the number of channels or spectrometers connected. Each individual window is labeled with the serial number of its corresponding spectrometer, allowing for easy identification and differentiation between spectrometers.

Within each individual window, there is an option to capture spectrum, take dark and light references specific to that channel. This feature allows users to calibrate and apply reference measurements to each channel independently, ensuring accurate and reliable data analysis. To perform the task for all channels at once, use the capture, take dark, and light references at the toolbar.
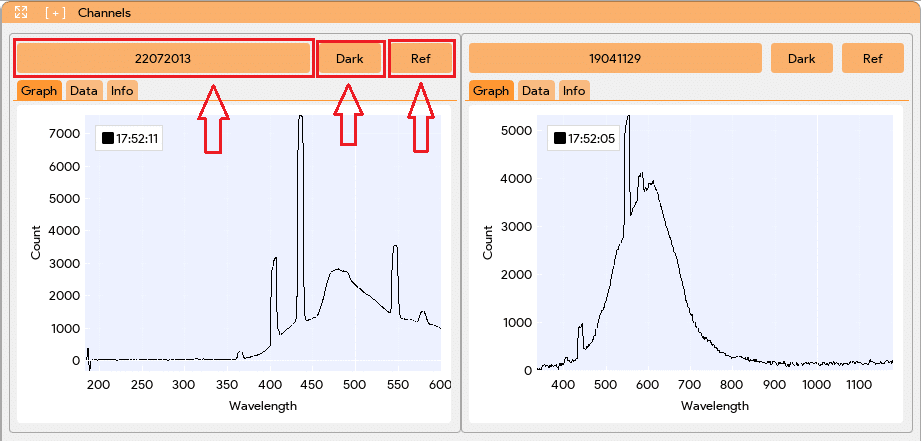
Each window for each spectrometer in the Multichannel app consists of three tabs. Graph tab displaying the spectrum or data visualization for the respective spectrometer. Application data tab providing relevant information and data associated with the selected application. Information tab within each window that allows users to load calibration or standard files specific to the corresponding spectrometer. This feature enables users to apply calibration or reference data to enhance the accuracy and reliability of their measurements.