
|
Sets new detector integration period |
|
Y axis smoothing improving S/N ratio |
|
X axis smoothing improving S/N ratio |
|
Periodic baseline shift compensation |
|
Selects modes for Standard/Extended |
|
Collect spectral data over time |
|
Select wavelength and trigger level |
|
Enable drift correct or mapping |
|
Auto find and continuous mode |
|
Scan request speed |
|
Color selections |
|
Allows customization of title line |
|
Hardware setup for instrument |
|
Setup for wavelength readout |
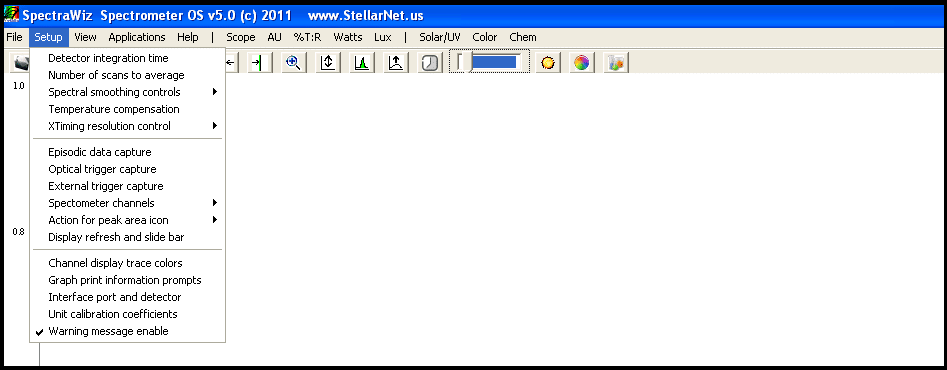
Detector integration time
Warning message Enable: Disable/enable new dark save needed
This should be adjusted for each experiment to maximize the detector output and signal to noise ratio. The integration time is reported in the status bar message at the bottom of the graph (as Time: xx milliseconds). The toolbar slide bar can be used to dynamically set the appropriate level without
Number of scans to average (1…999)
Saturating at the graph top.
Sets the number of spectra to signal average. Please note that the real-time display is updated AFTER these numbers of spectra have been acquired. This option provides a smoothing in the Y-axis, effectively increasing the system signal to noise by the square root of the number of scans being averaged. Set the averaging to the highest number tolerable when there is sufficient light signal and the detector integration time is short. Even when you have a moderate level of signal, it is best to wait a few seconds to improve the measurement quality.
Recommendations:
| Integration Time | Sample Average |
| 1-100 ms | 10 |
| 100-500 ms | 5 |
| 500+ ms | 3 |