
Raman App
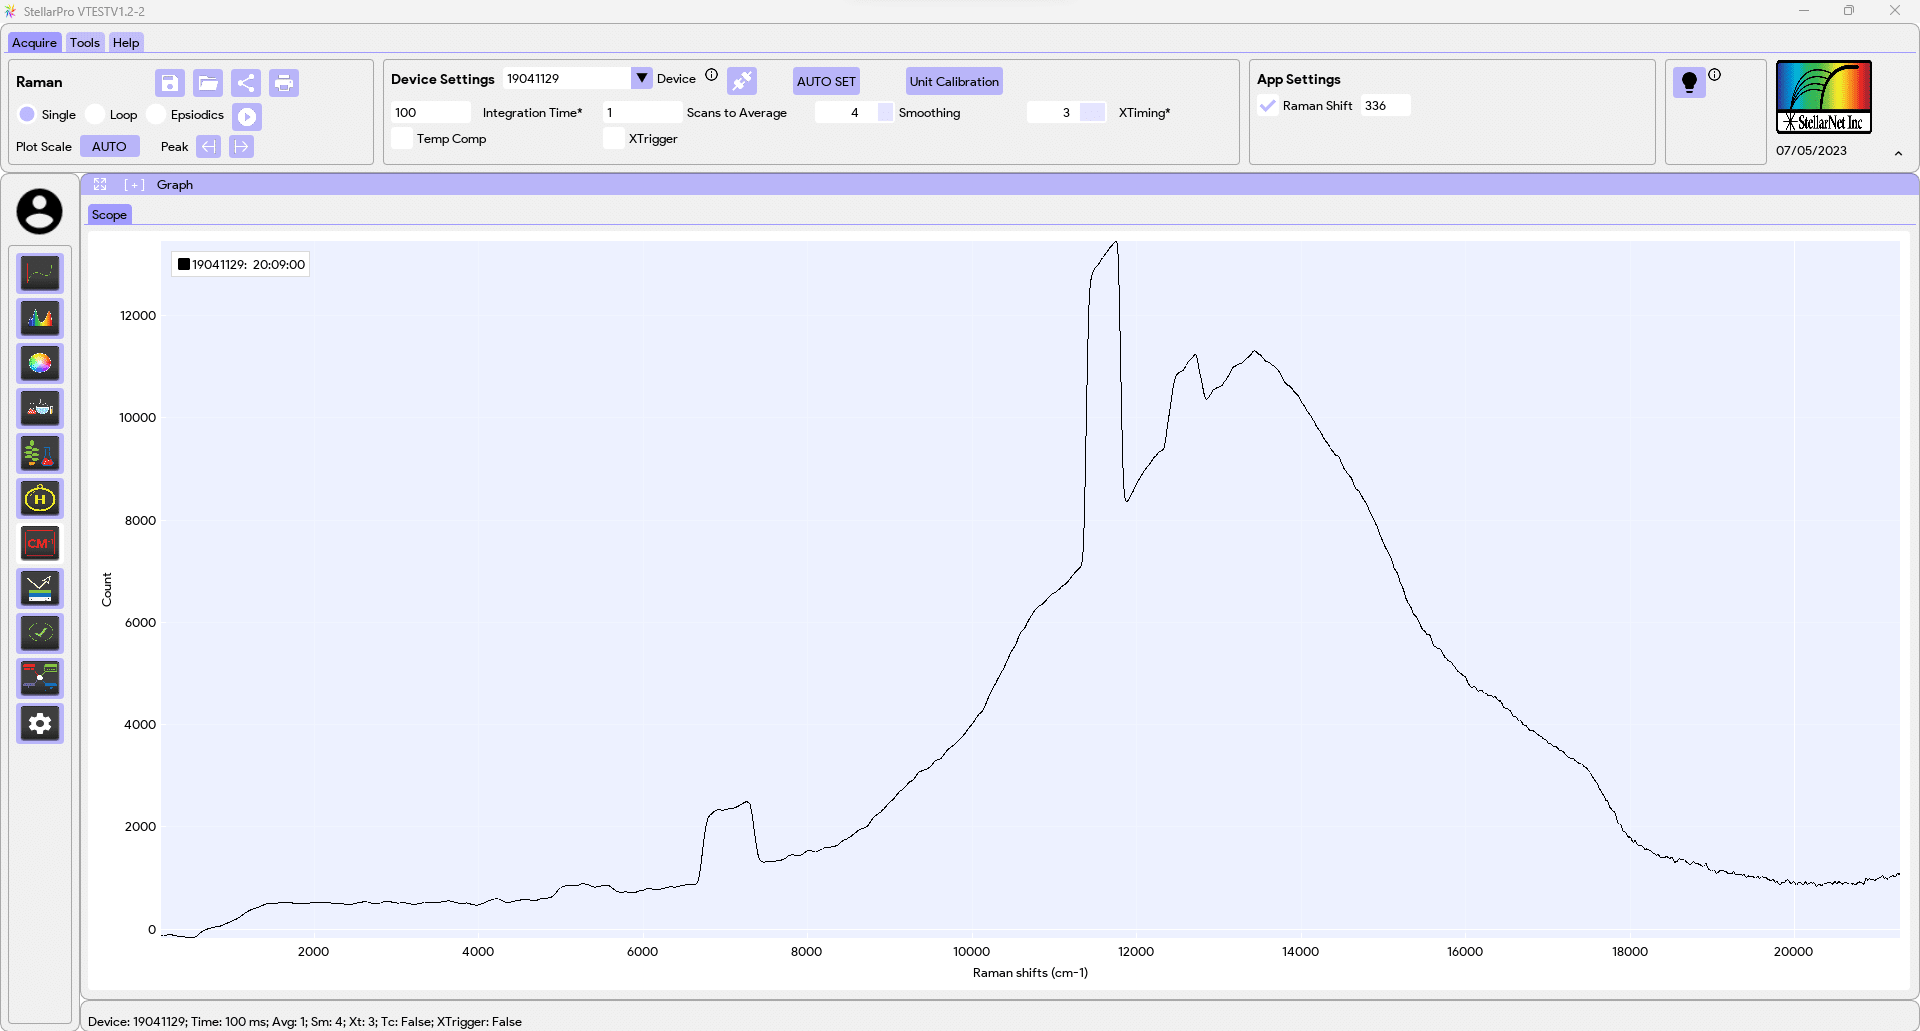
The Raman app is specifically designed to represent spectrometric data in Raman Shift space. Raman Shift is a term used in Raman spectroscopy to describe the shift in wavelength or frequency of light due to Raman scattering. The Raman app utilizes this concept to plot and analyze spectrometric data in the Raman Shift space.
By representing the data in Raman Shift space, the app allows users to observe and analyze the Raman scattering patterns specific to their samples. This space provides valuable information about the molecular vibrations and interactions within the sample, enabling the identification and characterization of different chemical compounds and materials.
Through the visualization and analysis of spectrometric data in Raman Shift space, the Raman app offers insights into the unique spectral fingerprints and vibrational signatures of the samples, facilitating various applications such as material analysis, chemical identification, and scientific research.
App Settings
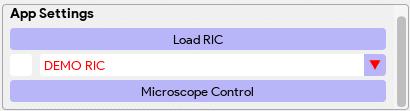
- Load RIC: Raman intensity correction is essential for obtaining accurate and reproducible spectra by compensating for variations in the spectrometer’s optical response. This correction process involves measuring the instrument’s spectral sensitivity using a calibrated broadband light source with a known, smooth emission profile. By comparing the measured spectrum of this standard source to its theoretical intensity distribution, a correction factor is derived and applied to the Raman spectrum. This process accounts for wavelength-dependent variations caused by detector sensitivity, grating efficiency, and other optical components, effectively eliminating artificial bumps or distortions. As a result, the corrected Raman spectrum accurately represents the true Raman signal, ensuring consistency across different instruments and experimental setups.
- Microscope Control: A Raman microscope equipped with an automated XY stage enables high-resolution Raman mapping, allowing precise characterization of spatial variations in Raman intensity at specific Raman shift values (cm⁻¹). This system systematically scans the sample in both the X and Y directions with micron-level resolution, capturing Raman spectra at each point to analyze chemical composition, molecular structure, and phase distribution. By integrating software control, users can configure scanning parameters, align the optical system, and automate data acquisition for seamless mapping. The collected spectral data is processed to generate a 2D Raman intensity map, providing a visual representation of material properties and enabling direct comparison of Raman fingerprints across different sample regions. This capability is particularly useful in material science, pharmaceuticals, and semiconductor research, where spatially resolved chemical characterization is critical.
Get started with the Raman application!