

The Concentration app utilizes the absorbance of light at a specific wavelength to calculate the concentration of a chemical compound. It establishes a linear relationship between absorbance and concentration through calibration, enabling accurate concentration determination. This functionality is valuable in various applications such as chemical analysis and quality control. It provides a reliable and efficient method for determining compound concentrations using spectroscopic analysis.
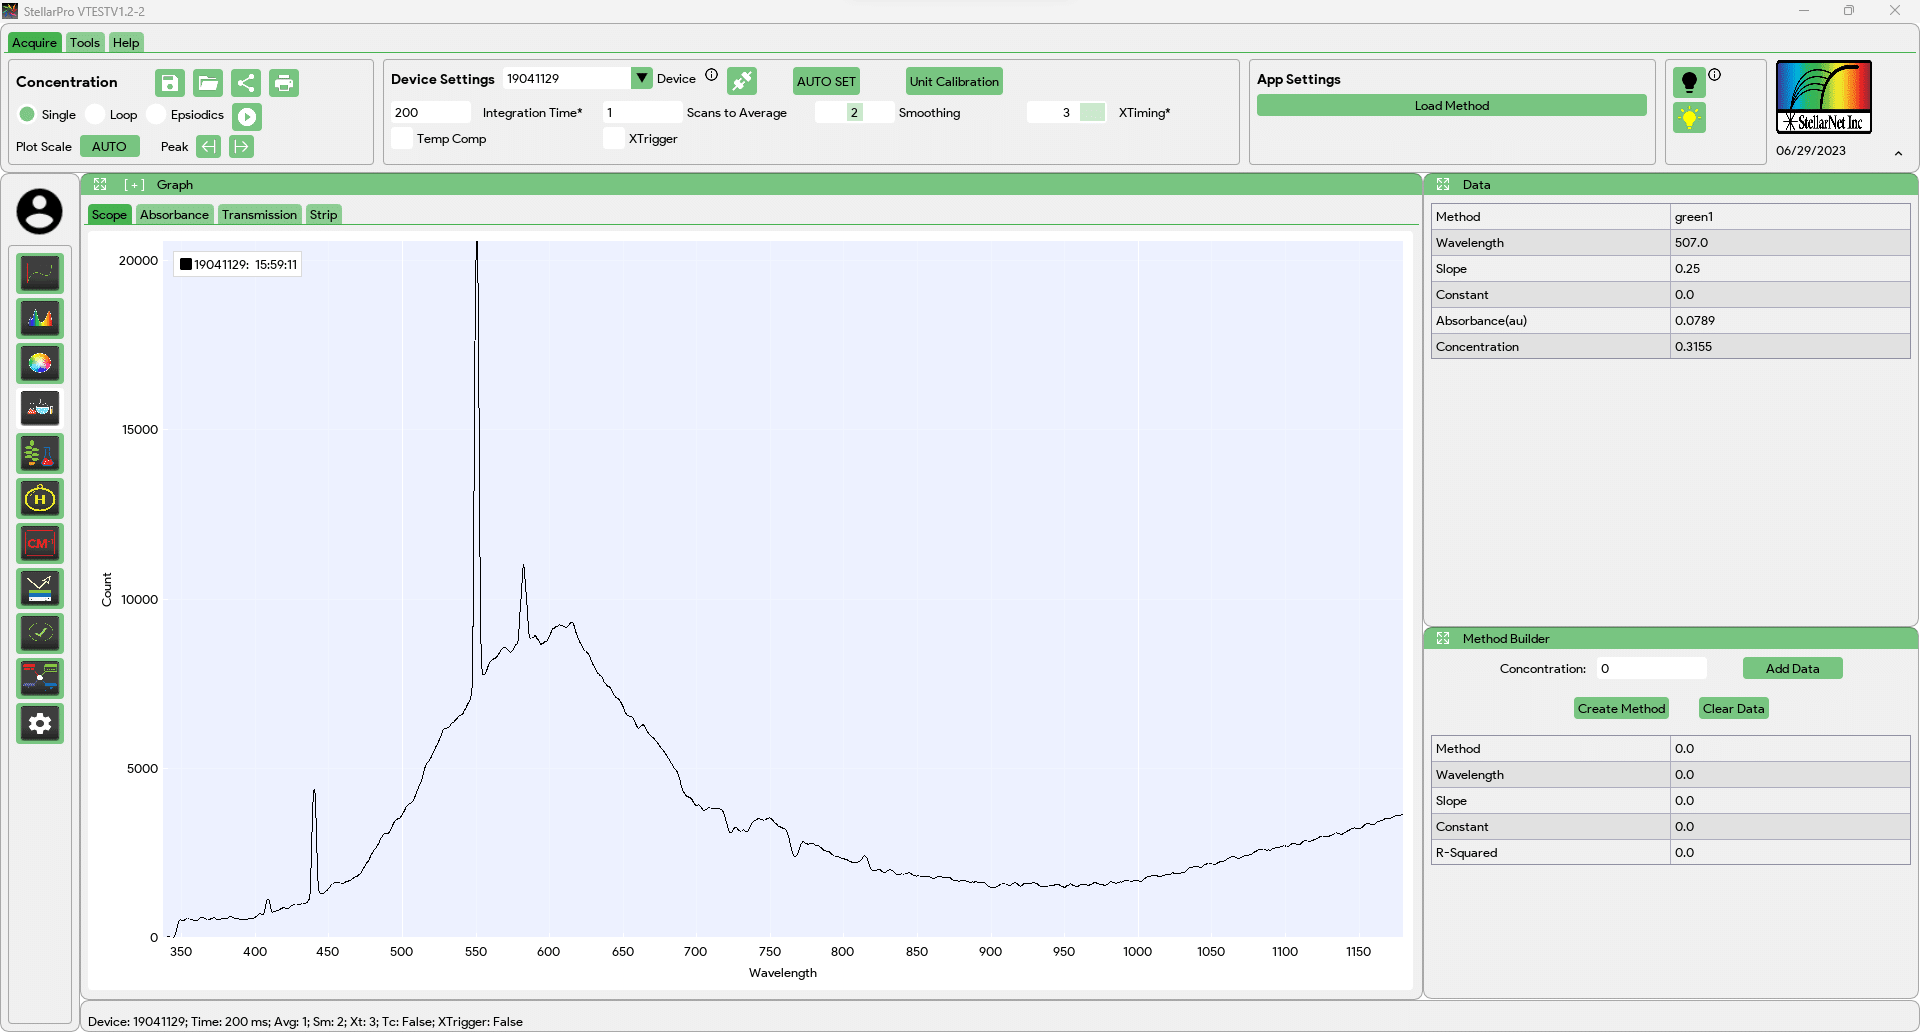
App Settings
![]()
The “Load Method” button enables users to load a method file by default located in Stellar Pro Data/Concentration; containing slope and constant values for the linear equation specific to a wavelength. This information is essential for relating absorbance values to corresponding concentrations.
Windows
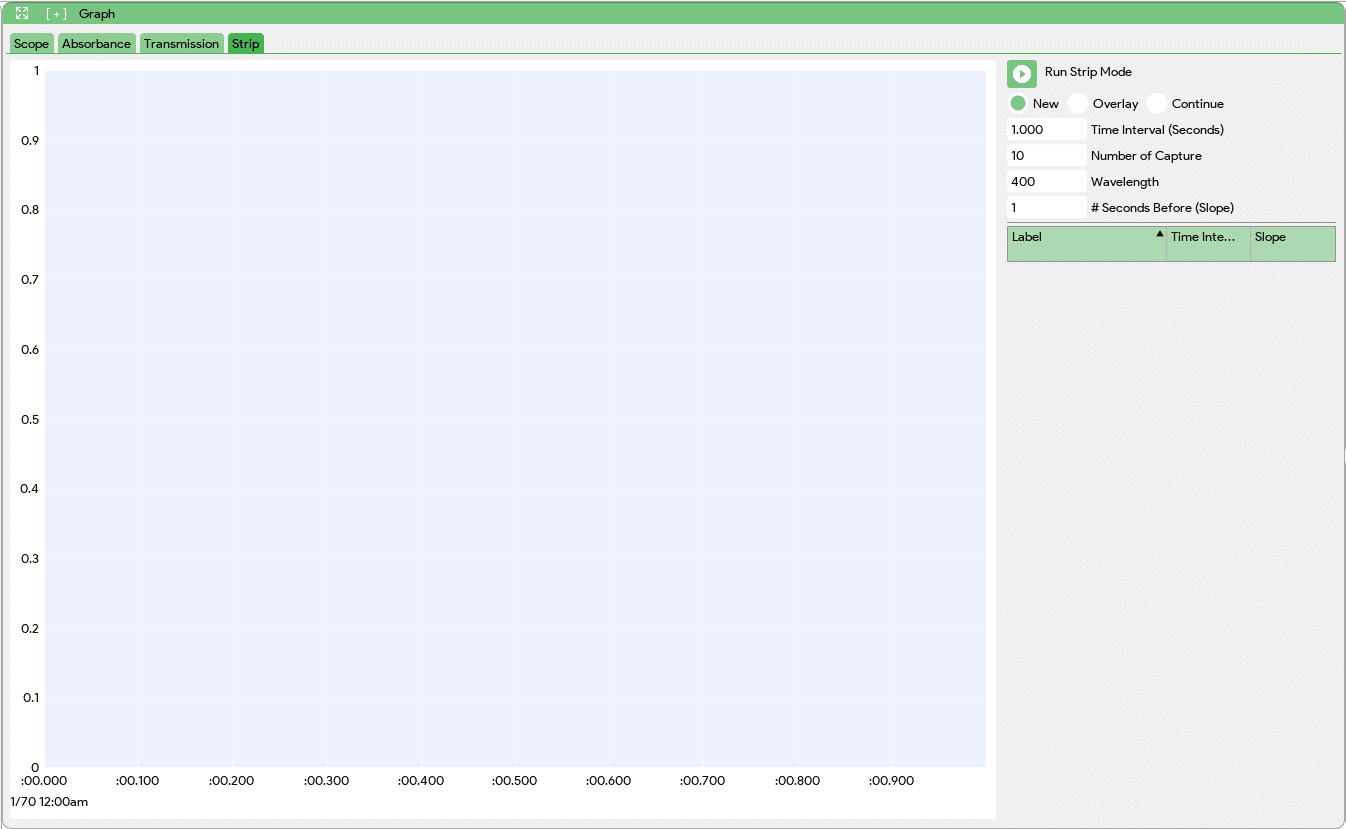
- The Graph Window provides various graphs, including Scope mode, Transmission, and Absorbance. These graphs visualize the spectral data, raw data from the spectrometer (16-bit range), light transmission through the sample, and light absorption by the samples in absorbance units (Au). Additionally, strip testing enables time series analysis of the sample’s light absorbance at a specific wavelength. Users can input parameters such as time interval in seconds, the number of captures, wavelength, and the time point for slope calculation. This functionality allows for the evaluation of concentration changes over time, providing valuable insights for dynamic analysis and monitoring of samples.
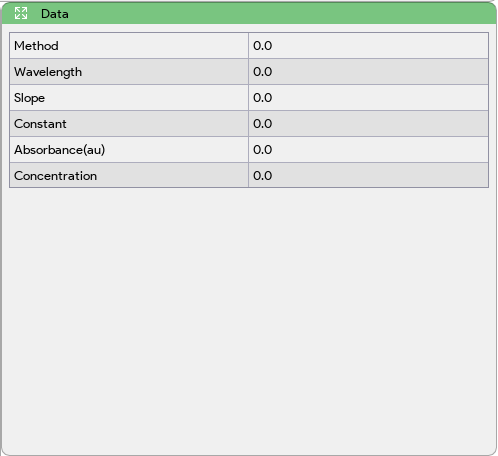
- The Data window in the concentration app displays various information related to the loaded method file and concentration calculations. It presents details such as the loaded method file, the selected wavelength for analysis, the corresponding slope and constant values from the method file, the measured absorbance of the sample, and the calculated concentration based on the absorbance and the linear equation defined by the slope and constant. This window provides a comprehensive overview of the input parameters, measurements, and calculated concentration results, aiding in accurate analysis and tracking of concentration values.
- The Method Builder Window in the concentration app allows users to create a calibration method file using a linear line equation.
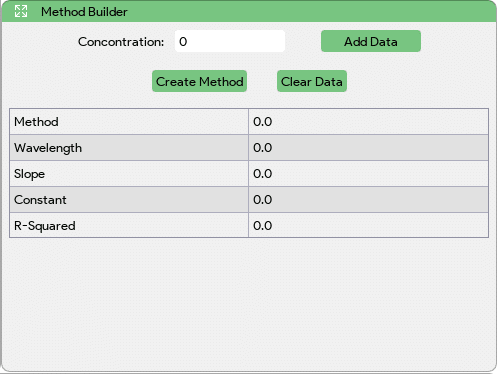
| “Add Data” button : Users will press the capture button to capture a spectrum and then input the measured concentration value in the textbox. After that, they can press the “Add Data” button to add the data to the method. | |
| “Clear Data” button : All existing data can be cleared by pressing this “Clear Data” button. | |
| “Create Method” button : Once all the data is added, users can press the “Create Method” button. They will be prompted to name the method file. The application will then calculate the slope and constant values, as well as evaluate the goodness of fit for the calibration curve. Finally, the calculated values and the goodness of fit information will be saved to the method file, enabling future concentration calculations based on absorbance measurements. |