The Thin Film Measurement App is specifically designed to measure the thickness of a single-layer film using the transfer matrix method and reflectance data. This app utilizes the principles of thin film interference and the transfer matrix formalism to calculate the thickness of the film based on the changes in reflectance at different wavelengths.
By analyzing the reflectance data obtained from the film, the app applies the transfer matrix method to model the optical behavior of the thin film. It considers the refractive indices and thickness of the film to determine the interference effects and calculate the film thickness accurately.
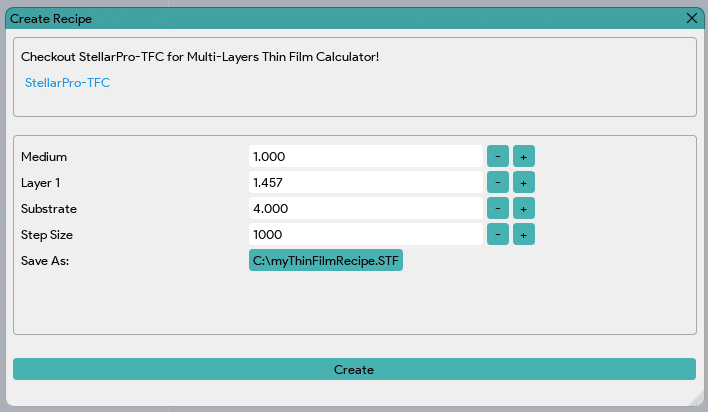
It is important to note that StellarNet also offers a separate software called StellarPro-TFC, specifically dedicated to the analysis of multi-layer thin films. This software provides advanced capabilities for the characterization and modeling of complex multi-layer thin film structures.
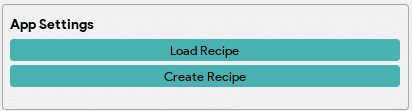
App Settings
|
The “Create Recipe” feature in the Thin Film Measurement App prompts a window where users can enter the refractive index values for the substrate, layer, and medium. Additionally, users can specify the step size for the iteration process. This step size determines the increment or decrement in the thickness of the layer during the calculation. This window also provides an option to save the results as a file, allowing users to specify the desired file path and name for easy reference and future use. Finally, click on the “Create” button to generate the recipe. |
| The “Load Recipe” feature in the Thin Film Measurement App enables users to load an existing recipe file from a specified location. By clicking on the “Load Recipe” button, users can navigate to the desired file location and select the recipe file they wish to load. Once the recipe file is selected, the app retrieves the stored parameters and settings from the file, including the refractive index values, step size, and any other relevant information. This allows users to quickly access and utilize pre-defined recipes, saving time and ensuring consistency in their thin film measurements. |
Windows
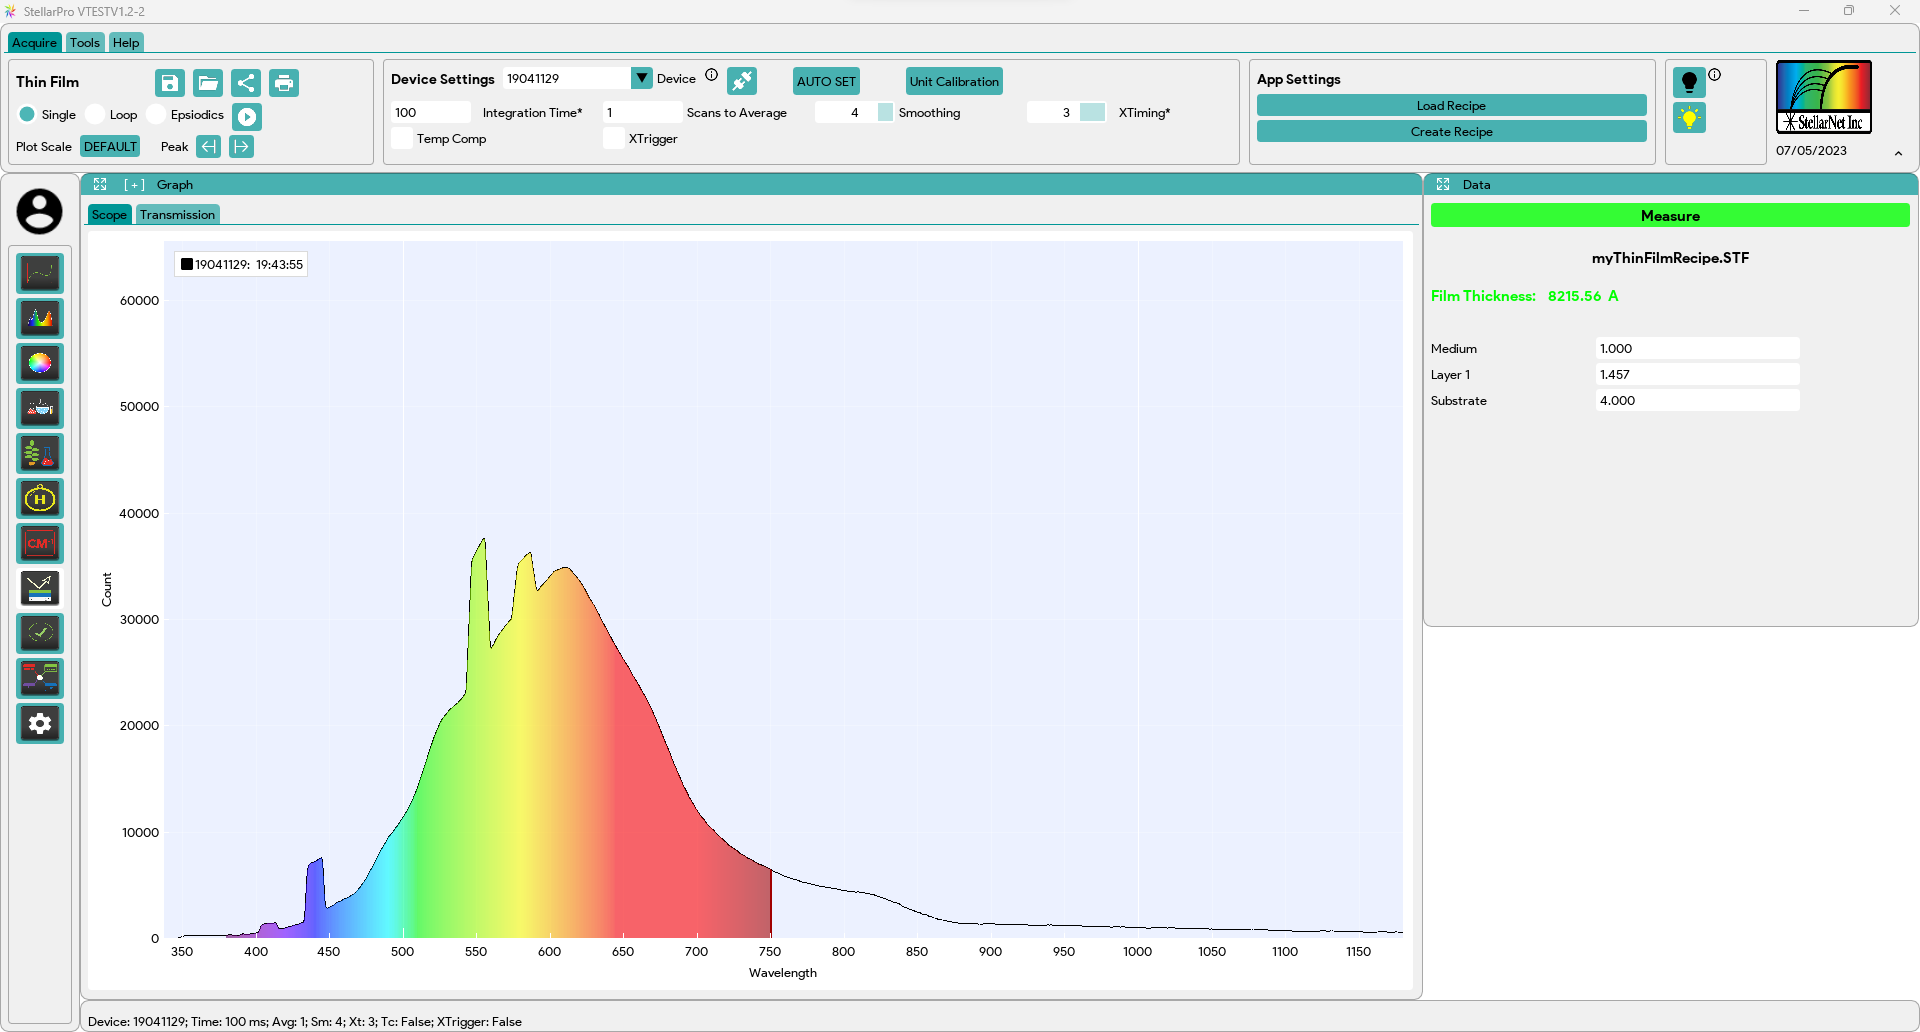
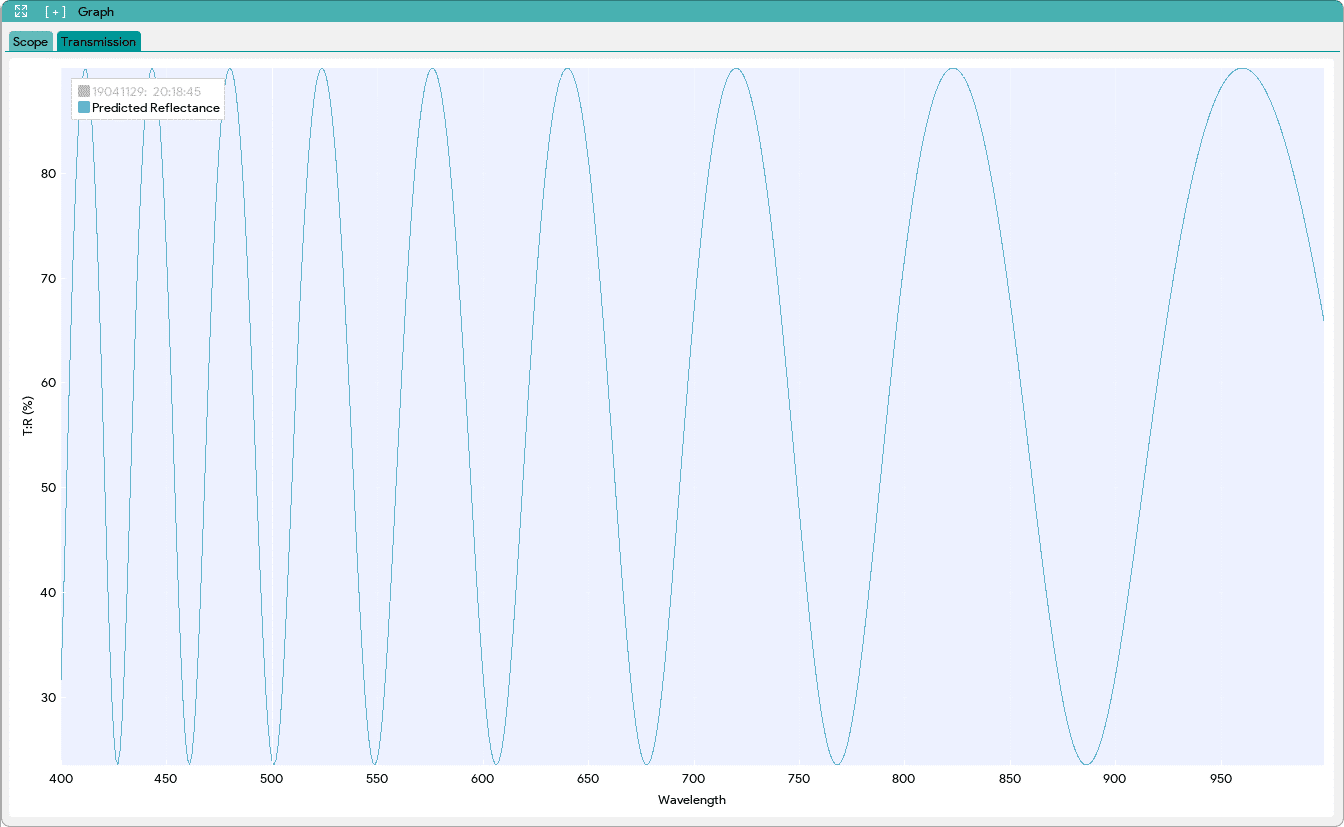
- Thin Film Measurement App displays two plots in the Transmission graph: the measured transmission data and the calculated reflectance data. By plotting both the measured transmission data and the calculated reflectance data on the graph, users can compare and assess the agreement between the experimental results and the theoretical predictions. This allows for the evaluation of the accuracy and reliability of the thin film measurement and analysis.
-
- The measured transmission plot represents the actual transmission values obtained from the spectrometer at different wavelengths. These values are measured directly during the experiment and provide information about the light that passes through the thin film sample.
- The calculated reflectance plot is derived from the transfer matrix calculations based on the entered refractive index values and layer thickness. It represents the expected reflectance values of the thin film at each wavelength.
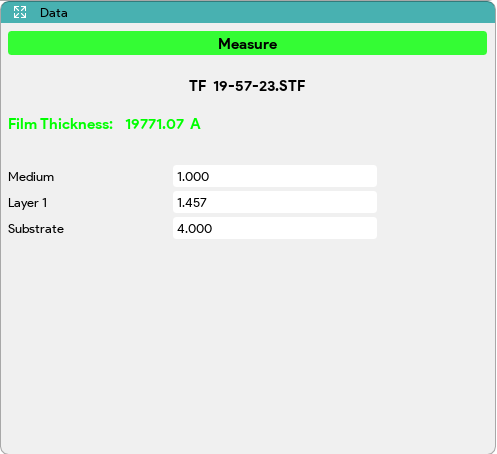
- The Data window in the Thin Film Measurement App includes a functionality to find high correlation between the calculated reflectance and the measured reflectance. This correlation analysis assists in estimating the thickness of the film. To perform the measurement, click on the “Measure” button. By comparing the calculated reflectance data, derived from the transfer matrix calculations, with the measured reflectance data obtained from the spectrometer, the app determines the degree of correlation between the two. It identifies the reflectance spectra that exhibit a strong correlation, indicating a closer match between the calculated and measured values. Based on the highly correlated reflectance spectra, the app provides an estimation of the film thickness. This estimation takes into account the correlation analysis and allows users to determine the thickness of the thin film more accurately.