The Haze app is designed to measure the Haze percentage of transparent and translucent samples. It provides both Haze % and CIE Lab color values as outputs. The app utilizes two methods, namely Total Transmission and Diffuse Transmission, to determine the Haze value.
The Total Transmission method measures the total amount of light transmitted through the sample, including both direct and scattered light. The Diffuse Transmission method specifically quantifies the scattered light component. By comparing these two measurements, the app calculates the Haze percentage, which represents the degree of light scattering within the sample.
App Settings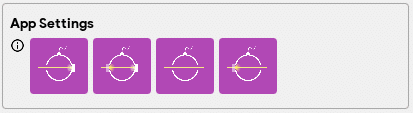
The App Settings section includes four buttons, each represented by a pictorial icon that corresponds to the step-by-step process of measuring Haze. These intuitive icons guide users through the sequential steps required to measure Haze accurately and efficiently.
 “Transmission Reference”: This button signifies the first step, where users are required to take a transmission reference measurement. This establishes a baseline for the measurement by capturing the transmission of light through a reference material or a clear sample.
 “Total Transmission”: The second button represents the step to measure the total transmission of the sample. Users need to place the sample in the measurement setup and capture the total transmission of light passing through it.
 “Diffuse Transmission Reference”: The third button indicates the process of capturing the diffuse transmission reference. This step involves taking measurements of scattered or diffused light using a reference material or a specially designed setup.
 “Calculate Haze“: The fourth button represents the final step, where users place the sample again in the measurement setup. By using the previously acquired transmission and diffuse transmission reference measurements, the app calculates the Haze percentage of the sample, providing the final result.
The Step-by-Step Guide, accessible under the Info icon ![]() , provides detailed instructions on how to configure the sphere setup for each step of the Haze measurement process. This guide assists users in properly setting up the measurement apparatus to ensure accurate and reliable results.
, provides detailed instructions on how to configure the sphere setup for each step of the Haze measurement process. This guide assists users in properly setting up the measurement apparatus to ensure accurate and reliable results.
The app automatically saves the transmission and diffuses reference measurements for future use, eliminating the need for users to repeat these steps each time they perform a measurement. Once the transmission reference and diffuse reference measurements are taken, the app stores the data in its memory or a designated location. This allows users to conveniently access and utilize the previously acquired references when performing subsequent Haze measurements. By eliminating the need for repeated reference measurements, the app streamlines the measurement process, saving time and ensuring consistent and accurate Haze calculations.
Windows
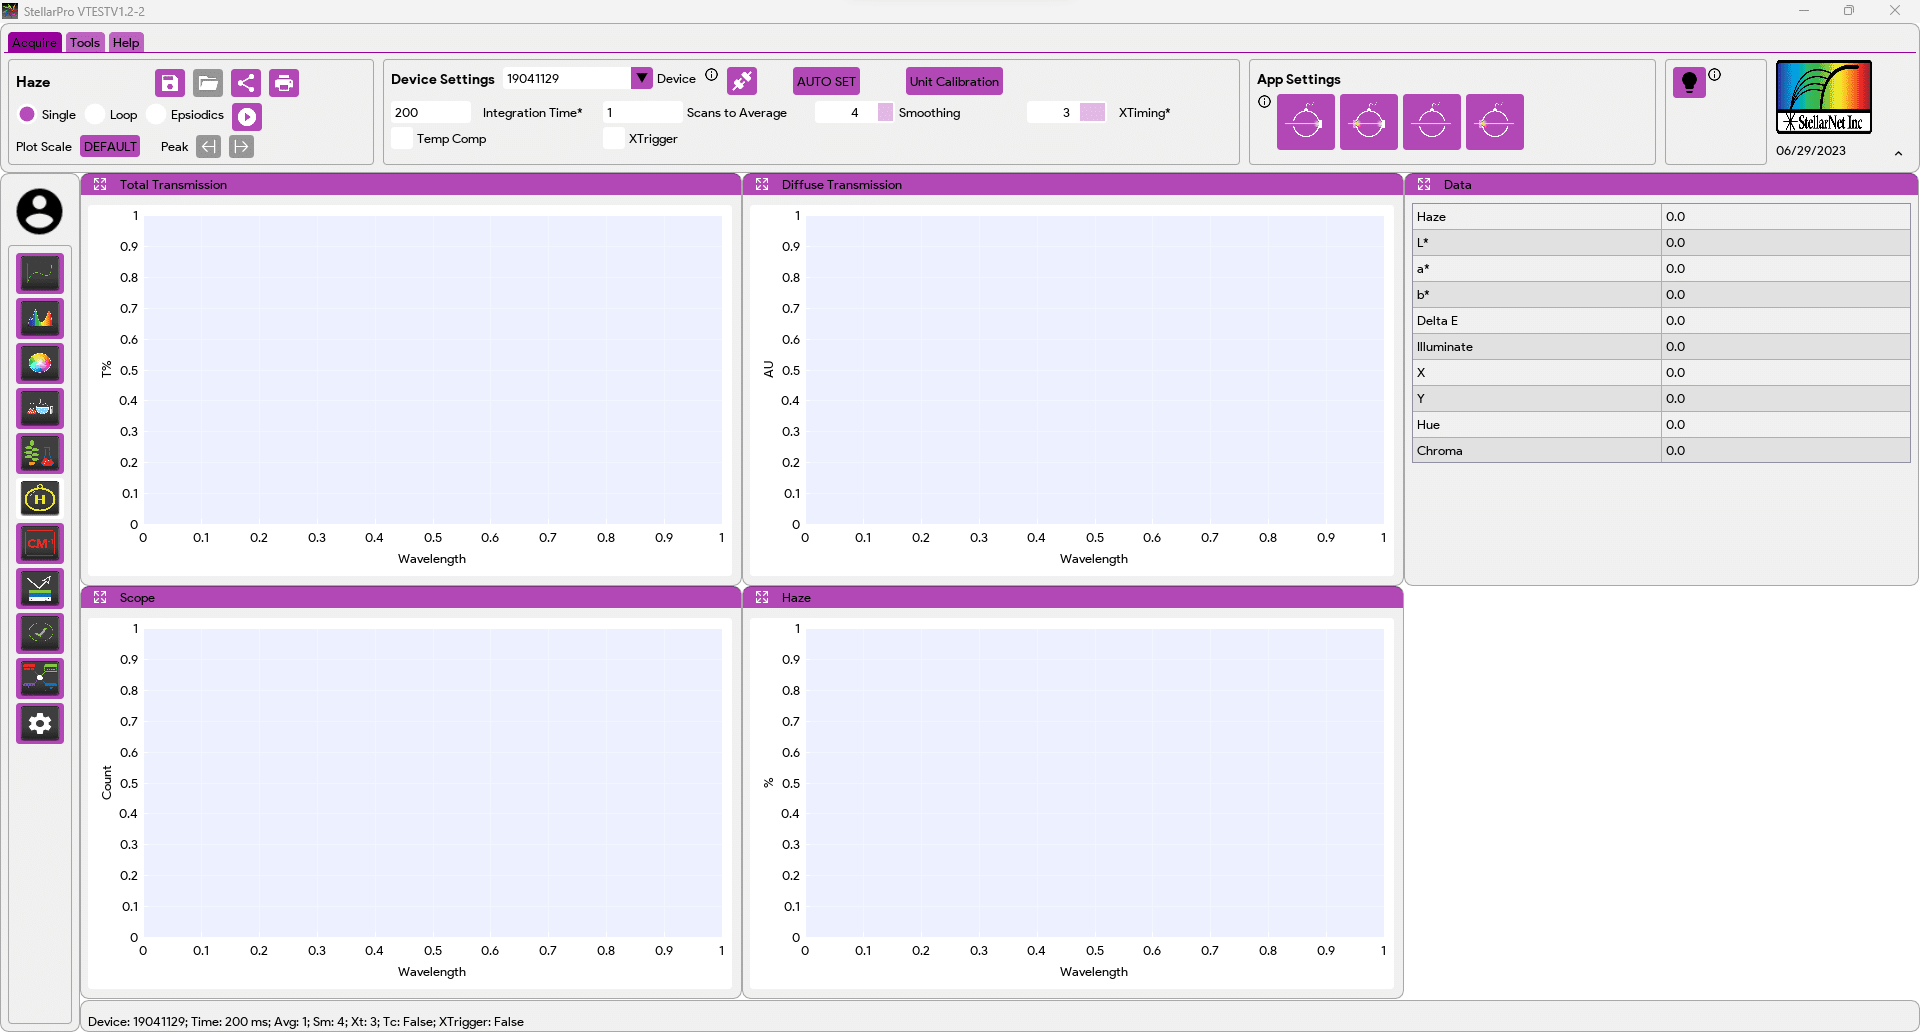
The Haze app features four separate graph windows, each representing and plotting the data for a specific step of the Haze measurement process, the app provides a dedicated graph window for each step, offering a clear and focused visualization of the data.
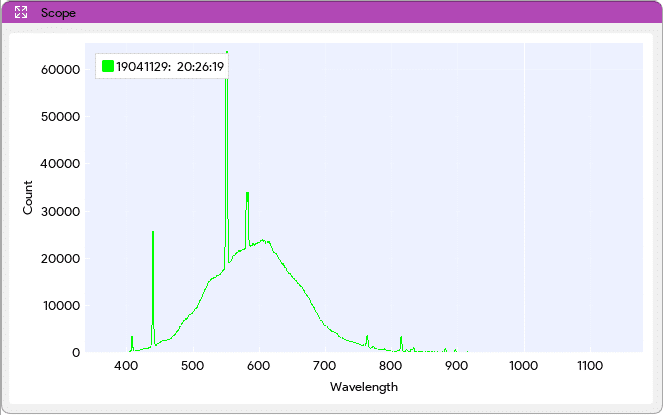
- “Scope Mode” graph that provides real-time visualization of spectrometric data during the measurement of references and samples. This feature enables users to monitor any potential issues or ambient artifacts that may affect the accuracy of the measurements. It is particularly crucial for open space measurement systems like the Haze system, where environmental factors and external influences can impact the measurements. By observing the spectrometric data in real time, users can identify and address any anomalies or artifacts, ensuring reliable and precise Haze measurements in open space environments.
- “Total Transmission Graph” is dedicated to plotting the data for the total transmission measurement. It illustrates the transmission values captured when the sample is placed in the measurement setup, providing insights into the overall light transmission through the sample.
![]()
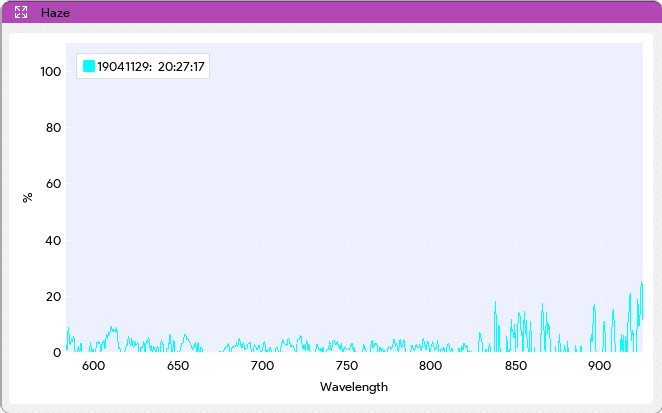
- “Diffuse Transmission Graph” focuses on plotting the data related to the diffuse transmission measurements. It visualizes the intensity or amount of scattered or diffused light captured during the measurement process. By presenting the diffuse transmission data in a graph format, users can analyze the scattering properties of the sample or the reference material. This graph provides valuable insights into the extent of light scattering within the sample, aiding in the accurate determination of the Haze percentage. It allows users to assess the scattering characteristics and evaluate the impact of scattering on the overall transparency or translucency of the sample.
![]()
- “Haze Calculation Graph” is specifically designed to plot the calculated Haze values. It visualizes the Haze percentage obtained by comparing the total transmission and diffuse transmission measurements, offering a clear representation of the degree of light scattering within the sample.
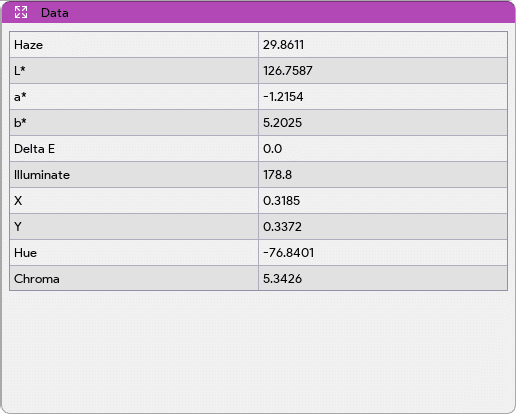
- The Data window in the Haze app focuses on providing a comprehensive overview of the average haze level across the spectral range. This information allows users to evaluate the overall haze or opacity of the sample. This window also provides the color representation of the sample. This can be in the form of CIE Lab color values or other color models, allowing users to understand the color properties of the sample in conjunction with the haze measurement. The color information enhances the characterization of the sample’s appearance, providing insights into its translucency and hue.