The Colorimeter app is specifically designed to analyze and evaluate the color of light reflected by objects such as solids, liquids, and powders. It employs a range of color analysis metrics and algorithms to provide comprehensive insights into the color properties of the sample.
App Setting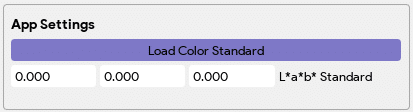
| Load Color standard: Users can load a CIE color file to calculate Delta E for color comparison. The loaded L*, a*, and b* values will appear in the manual entry below. | |
| Manual Entry: Instead of loading a file, users can directly enter L*, a*, and b* values for color evaluation and Delta E calculations. |
Windows
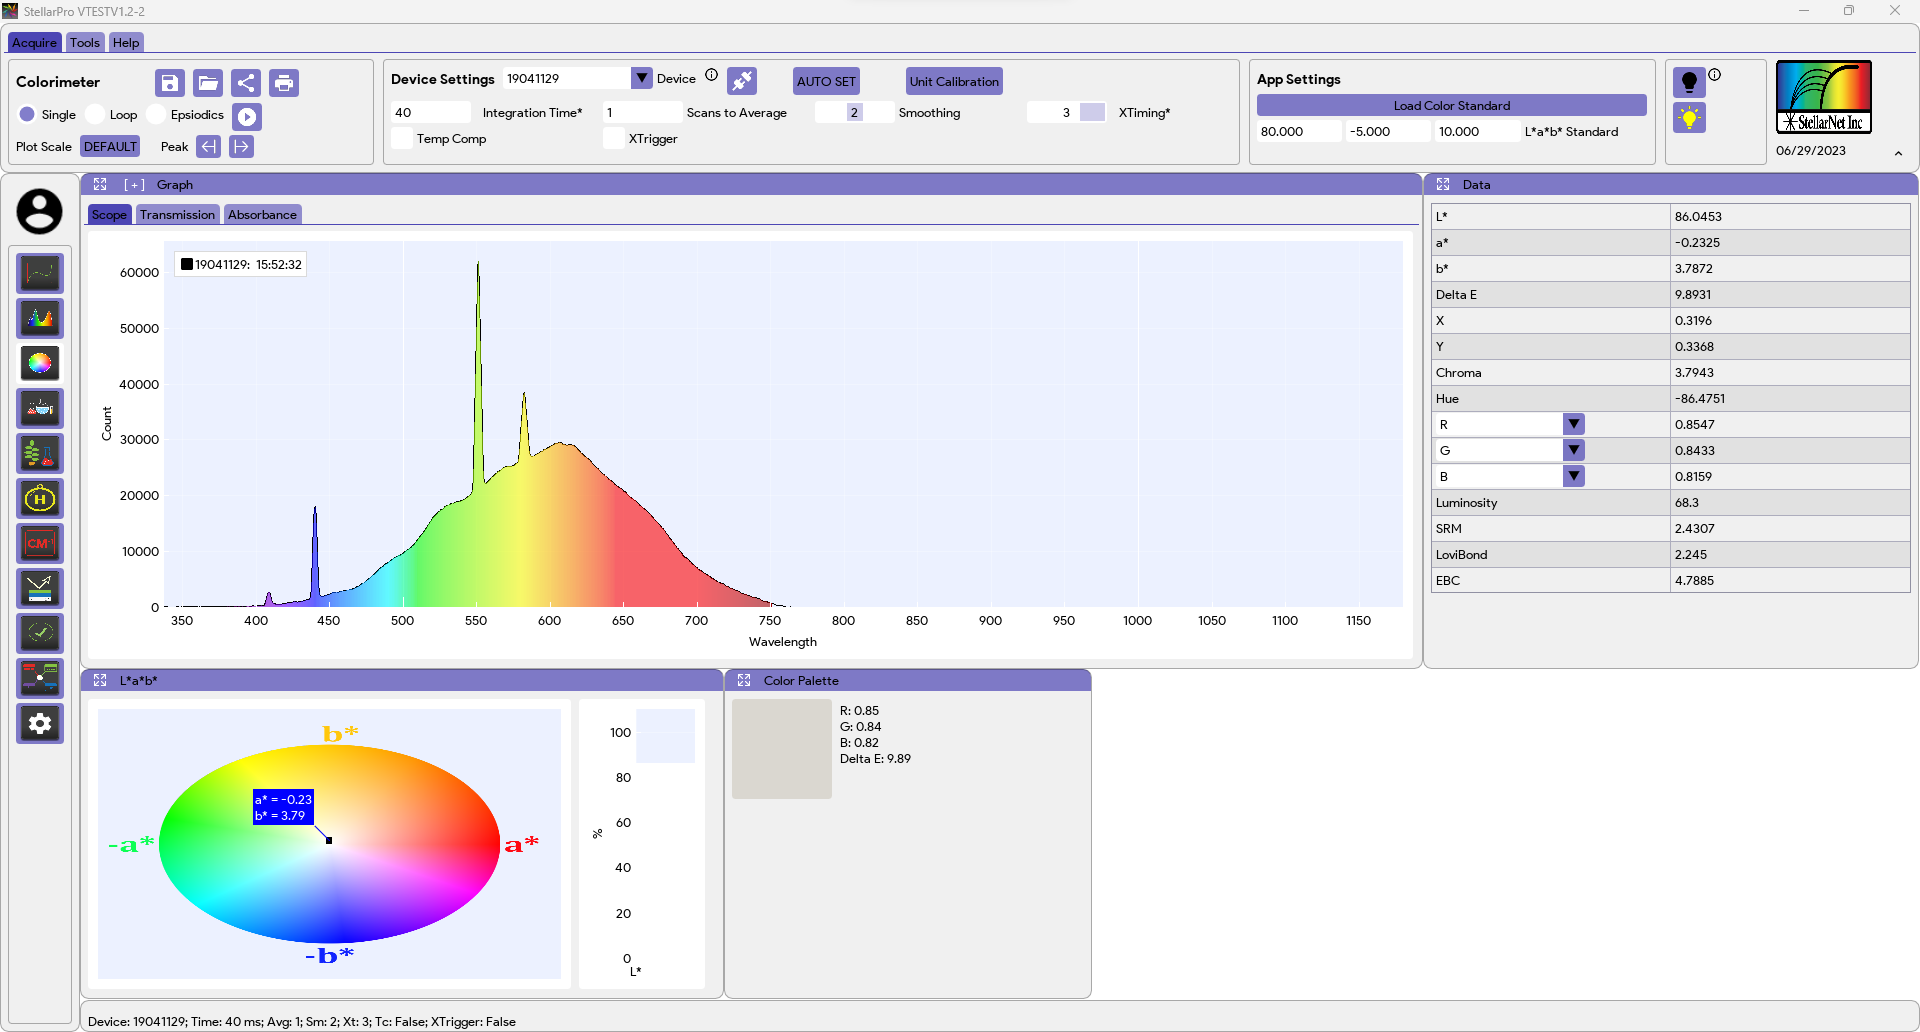
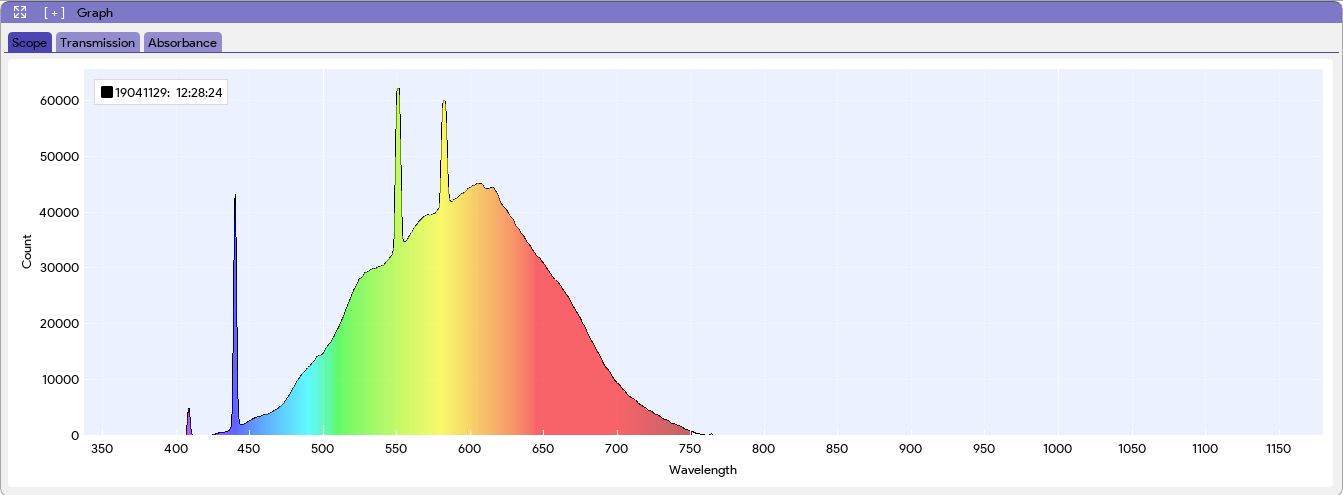
- Graph Window: The Graph Window provides various graphs, including Scope mode, Transmission, and Absorbance. These graphs visualize the spectral data, raw data from the spectrometer (16-bit range), light transmission through the sample, and light absorption by the samples in absorbance units (Au).
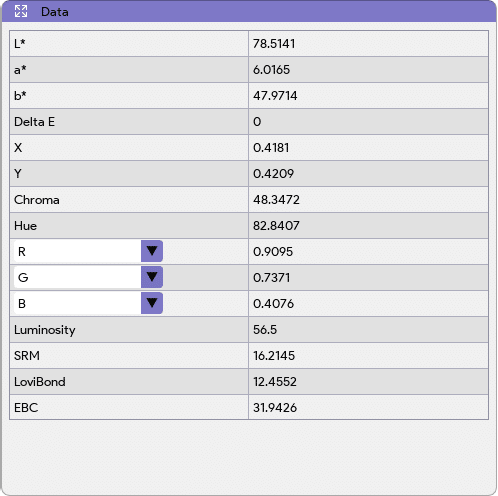
- Data Table: The Data Table section displays color representations of the object under test in different color spaces, such as Lab*, RGB, HSV, or other models. It allows users to analyze and compare color attributes quantitatively.
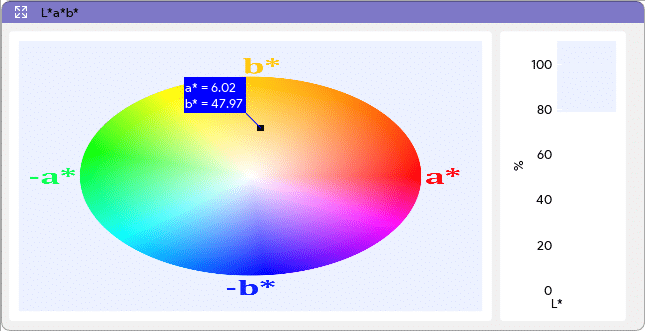
- Lab* Window: The Lab* Window plots the CIE Lab values of the object on a color wheel or space diagram. It provides a visual representation of the object’s color in terms of lightness, red-green, and blue-yellow components in the CIE Lab color space.
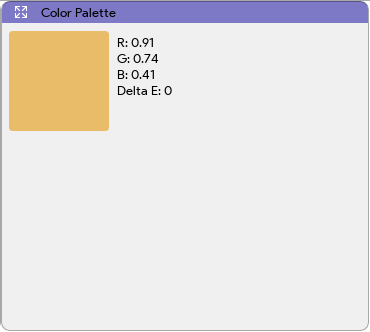
- Color Palette: The Color Palette section shows the actual color palette of the object. It includes RGB values and may also present Delta E values, indicating the color difference between the object’s colors and reference colors.