
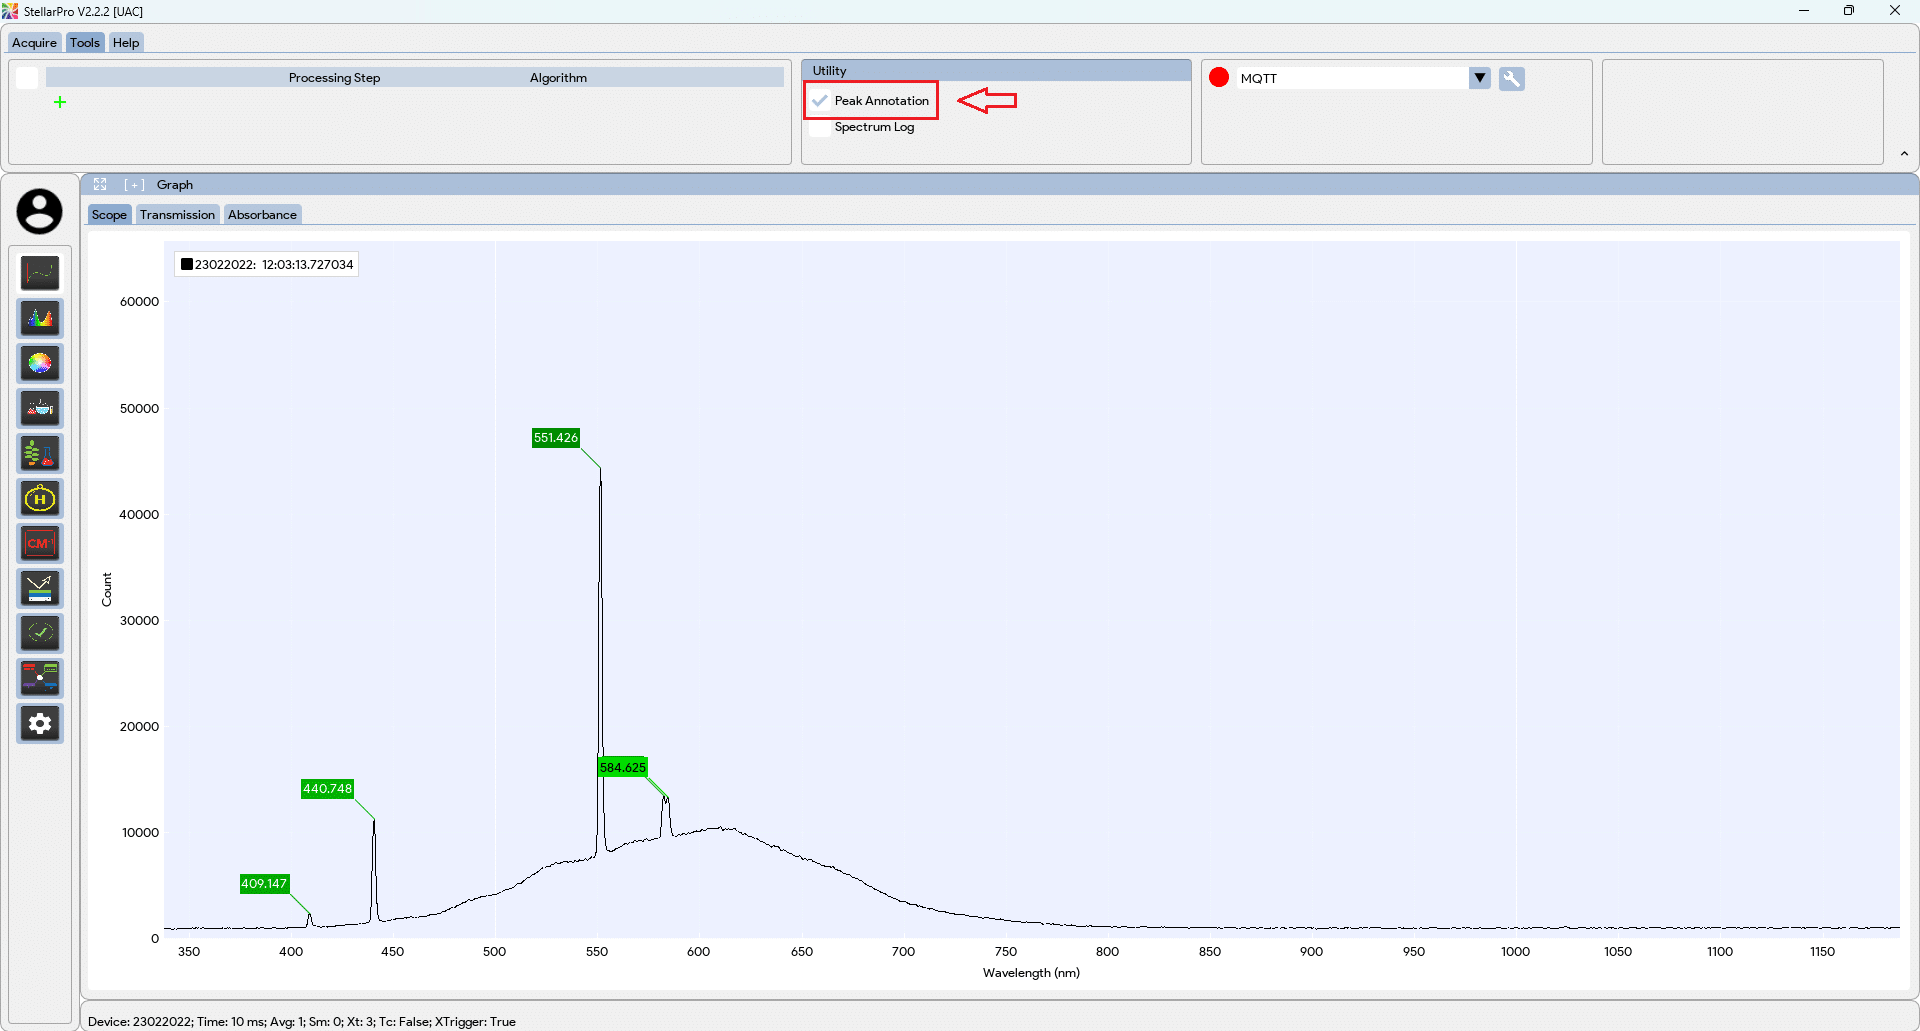
Peak Annotation: Enabling the checkbox will display all peak annotations for the last spectrum on the graph.
Peak settings, such as threshold %, minimum peak height Y, and minimum peak distance X, can be adjusted by checking the option in the Tools tab → Utility → Peak Settings, and a peak setting will appear on the right panel of each graph.
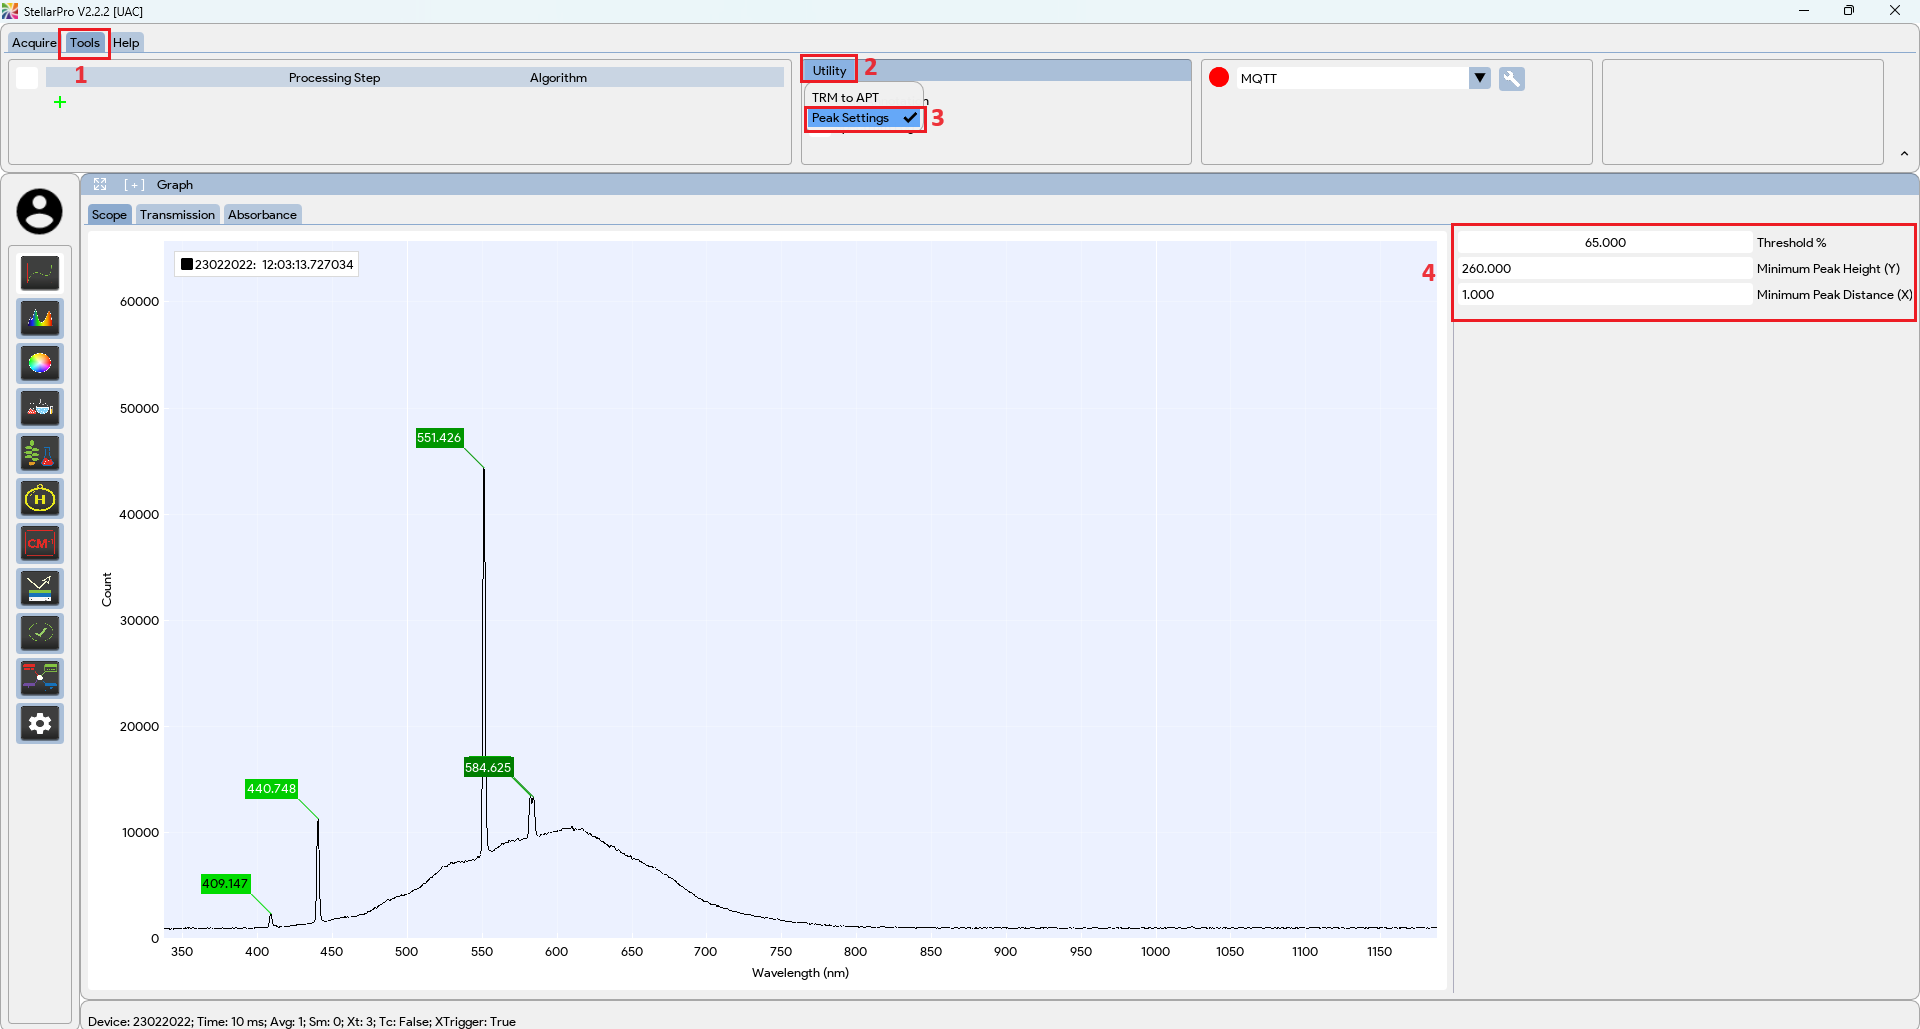
- Threshold %: Adjusting the threshold % helps in controlling the sensitivity of peak detection. It ensures that only peaks above a certain intensity level are identified, thereby filtering out noise or less significant fluctuations in the data.
- Minimum Peak Height Y: This setting specifies the minimum vertical distance between a peak’s highest point and the baseline below it that must be surpassed for the peak to be identified as distinct.
- Minimum Peak Distance X: This parameter sets the minimum horizontal separation between identified peaks, ensuring that closely spaced peaks are not mistakenly merged into a single peak during analysis.
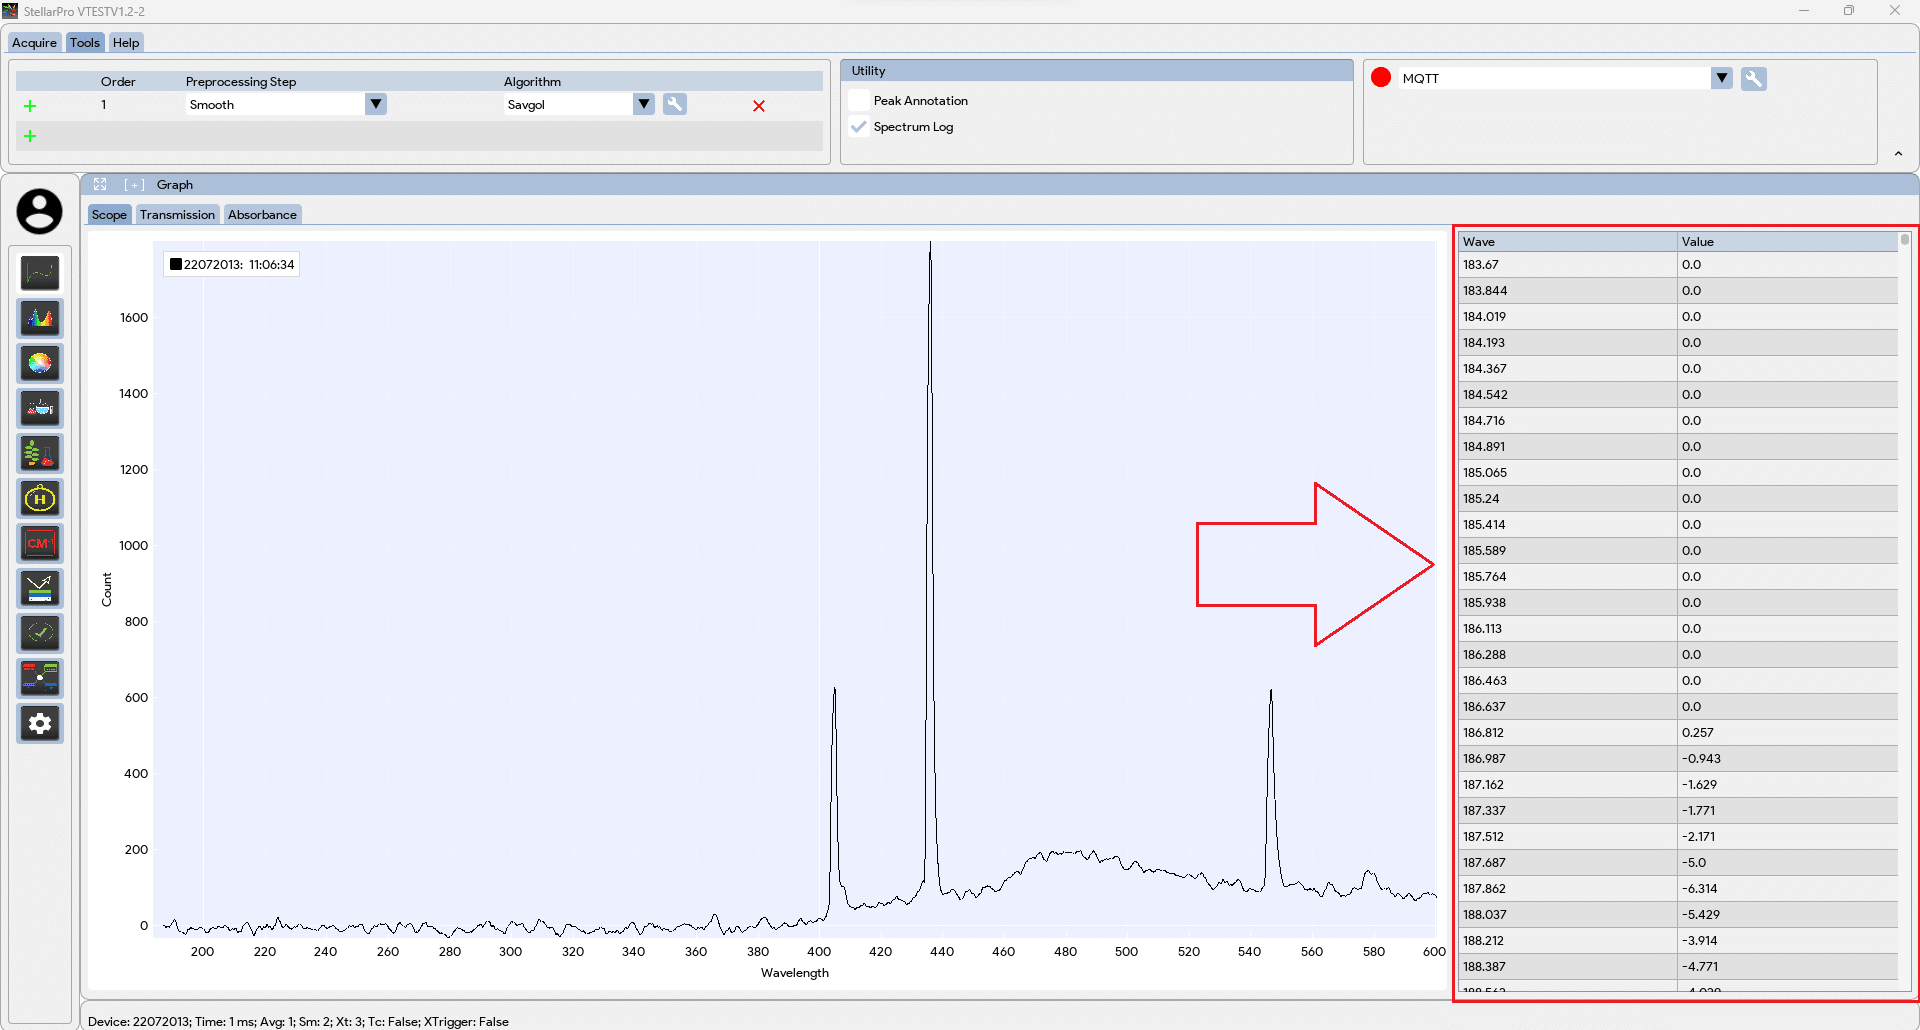
Spectrum Log: Enabling the checkbox will display a table next to the graph for the last spectrum captured.
TRM to APT: A TRM file can be converted to an APT file (wavelength-specific aperture compensation) for use in the Radiometer application. Follow these steps:
-
- Navigate to Tools tab, click on Utility → “TRM to APT”.
- In the file browser window, select the TRM file you want to convert.
- Click “Open”.
- In the new file browser window, choose the location to save the converted APT file.
