The Spectral ID app is designed to identify the best possible match for an unknown sample using either scope, absorbance, or transmission data. It utilizes a library of spectrometric data created by the user, which contains reference spectra of known samples.
The app employs the correlation coefficient as a similarity measure to compare the unknown sample’s data with the reference spectra in the library. The correlation coefficient indicates the strength and direction of the linear relationship between two datasets.
By calculating the correlation coefficient between the unknown sample’s data and each reference spectrum in the library, the app determines the best match based on the highest correlation coefficient value. This approach helps to identify samples that closely resemble the unknown sample in terms of their spectral characteristics.
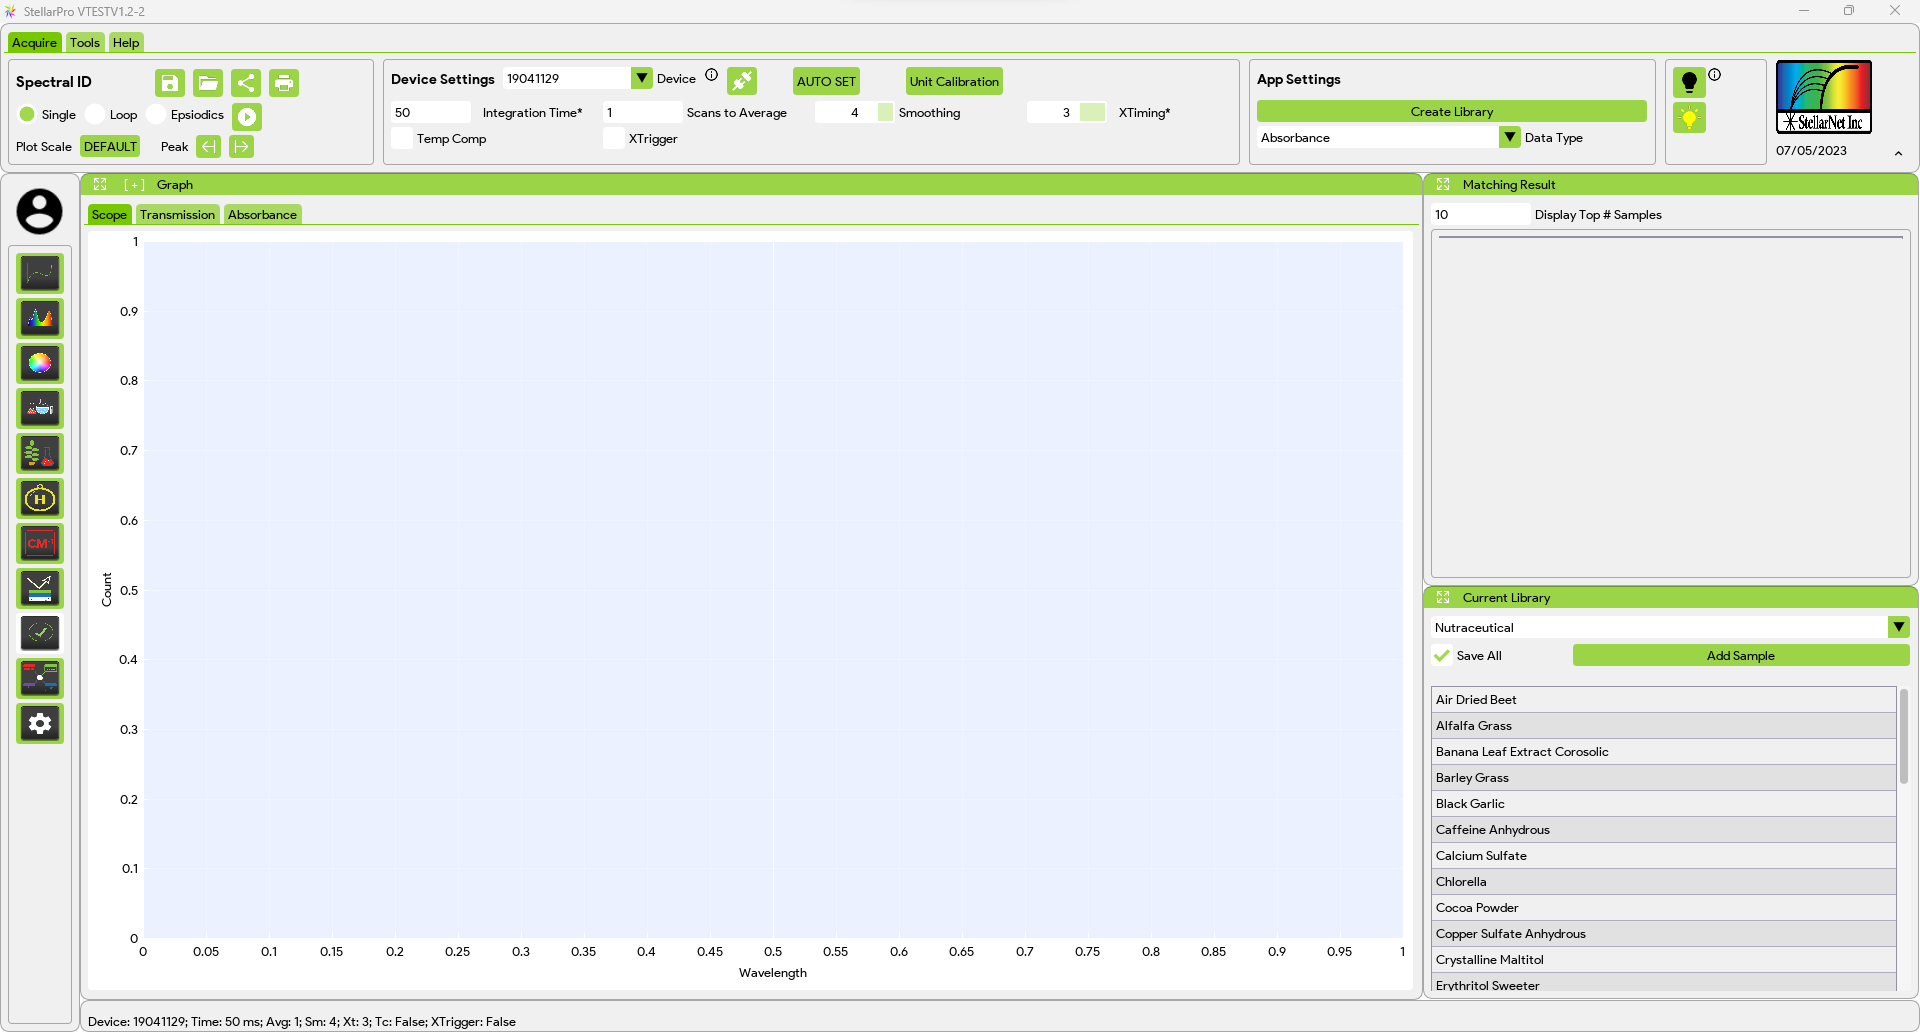
App Settings
| “Create Library” allows the user to specify the library name and the library will be created in the “StellarPro Data” directory located at the Desktop. The library directory serves as a storage space for all the data that the user wants to add and include in their library. | |
| The user can select the type of data they want to include for the matching (And only this data type will be saved if the “Save All” checkbox is not selected when a new sample is being added) from three options: scope, absorbance, and transmission. This allows flexibility in choosing the most relevant and appropriate data type for their particular application or analysis. |
Windows
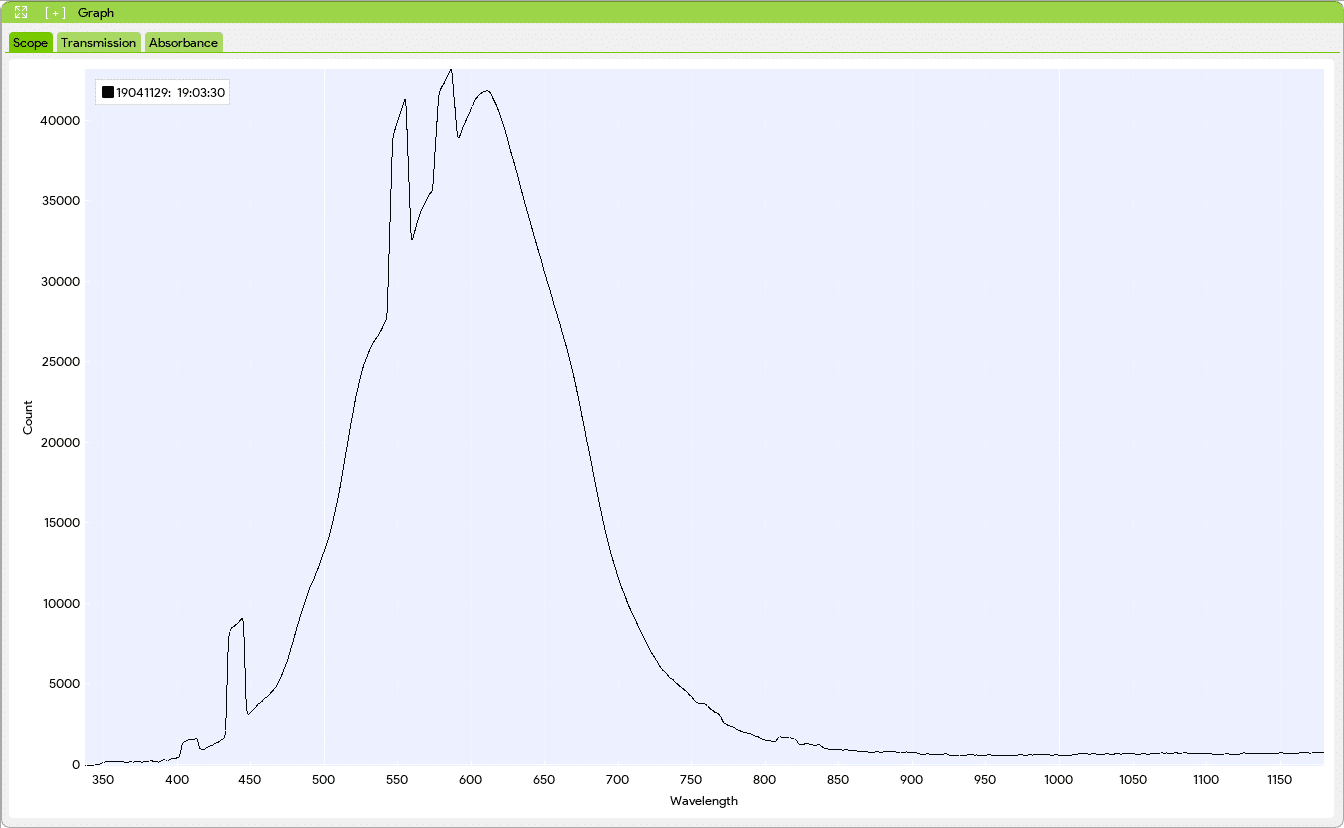
- The graph window that displays scope, transmission, and absorbance data. These graphs represent the spectral characteristics of the samples being analyzed and help in identifying unknown samples by comparing them to a user-created library using correlation coefficients.
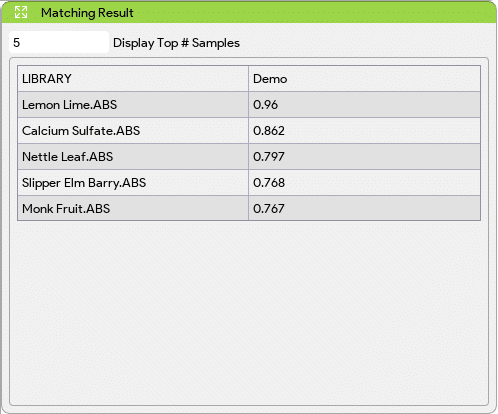
- The Matching Results window in the Spectral ID app displays the samples from the user-created library that best match the unknown absorbance data, ranked in descending order based on correlation coefficient. Users have the option to select the number of samples they want to see in the list.
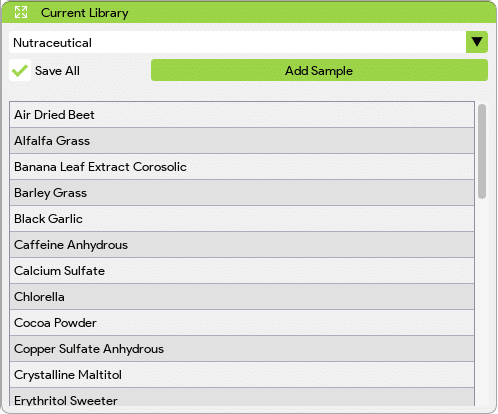
- In the Current Library window of the Spectral ID app, users can select different libraries from the dropdown list. They have the option to add data to the selected library, and the table below displays all the data in that library along with their respective names. This allows users to manage and organize their spectral data in different libraries for easy reference and analysis. Enable the “Save All” checkbox to save all three types of data (i.e., scope, absorbance, and transmission). If the “Save All” checkbox is disabled, then only the data type that’s selected in the App Settings will be saved.