Colorimeter – Apply Reflectance Corrected Data (RCD)
Reflectance correction is a crucial process in ensuring the accuracy of spectral measurements, particularly in applications involving light characterization, remote sensing, and material analysis. We use certified reflectance standards that come with their expected or calibrated reflectance values across the wavelength range of 250–2450 nm. These standards are traceable to recognized calibration laboratories, ensuring high precision and reliability. In our software, we adjust the measured reflectance of these standards obtained from our spectrometer to match their calibrated reflectance values. This correction process accounts for instrumental variations, optical misalignments, and environmental factors, enabling us to achieve accurate and consistent reflectance measurements for various samples.

- Turn on the computer. Open the StellarNet software by double clicking on the desktop icon StellarPro
 to open the application.
 - When you first open the software, you should see a screen similar to the one below:

- In the side navigation bar, select Colorimeter icon
 .
. - Choosing the Most Suitable Reflectance Standard: To avoid SCOPE intensity saturation, select the reflectance standard that is closest to your brightest sample, ensuring the selected standard has a reflectance value higher than the sample you are measuring. For example, if your sample has a reflectance value of 8%, choose a standard with a reflectance greater than 8% to maximize the SCOPE intensity. A 10% or 100% standard will work, but the 10% standard will provide the best results.
- Place the selected reflectance standard under the probe and turn on the light source. If you are using a reflectance standard other than the RS50, load the appropriate RCD file for that standard in the App Settings.

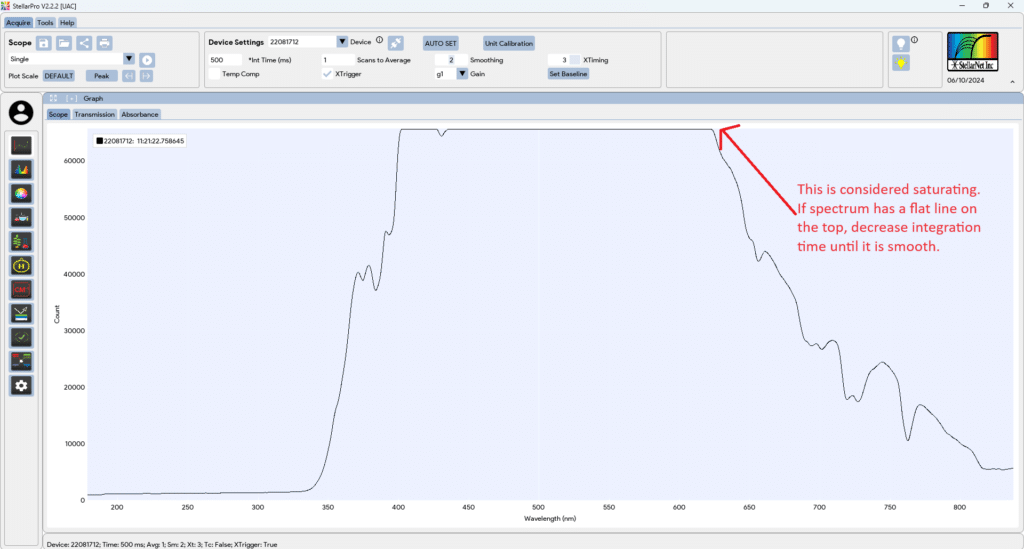
- Click on the Scope tab in the Graph window. This will show you the number of counts (photons) the detector receives. You should see a spectrum of counts versus wavelength.
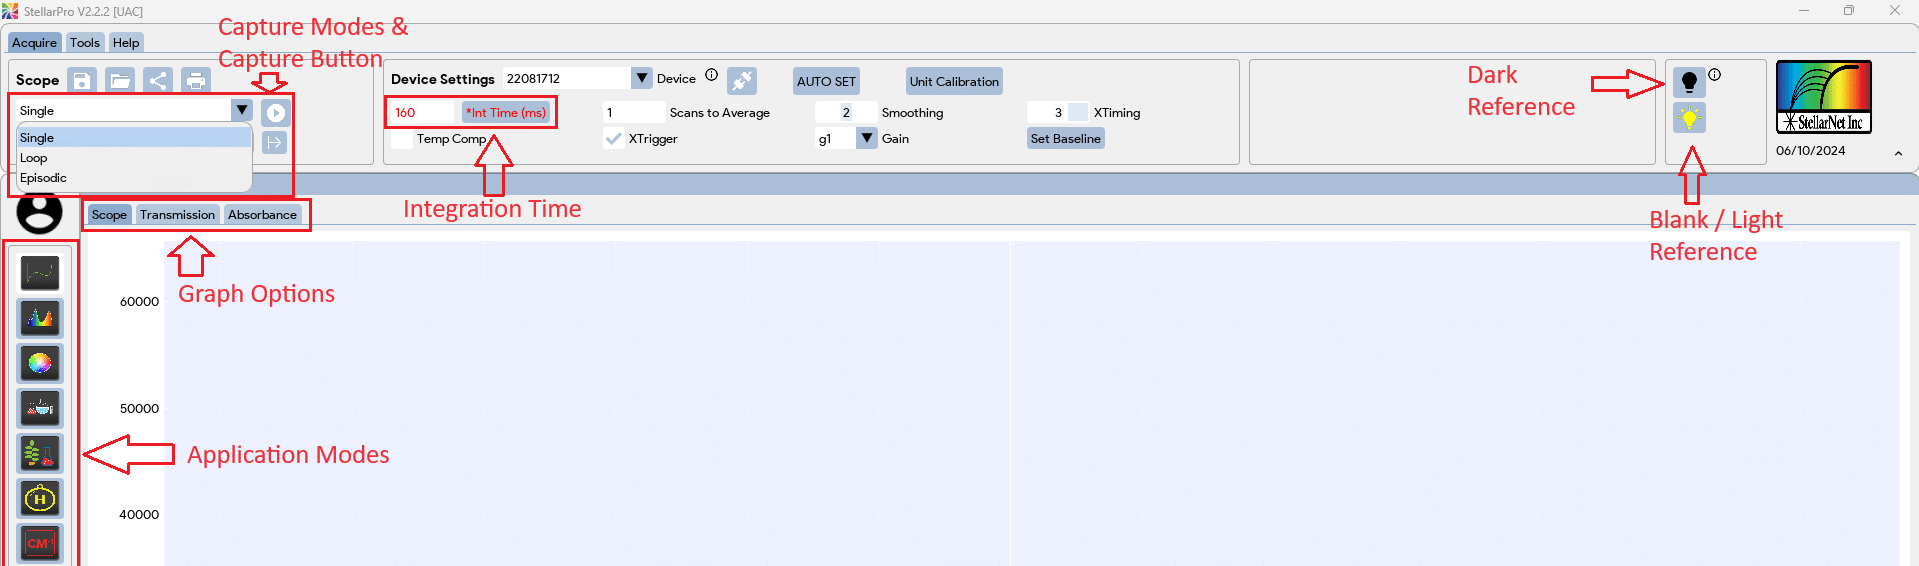
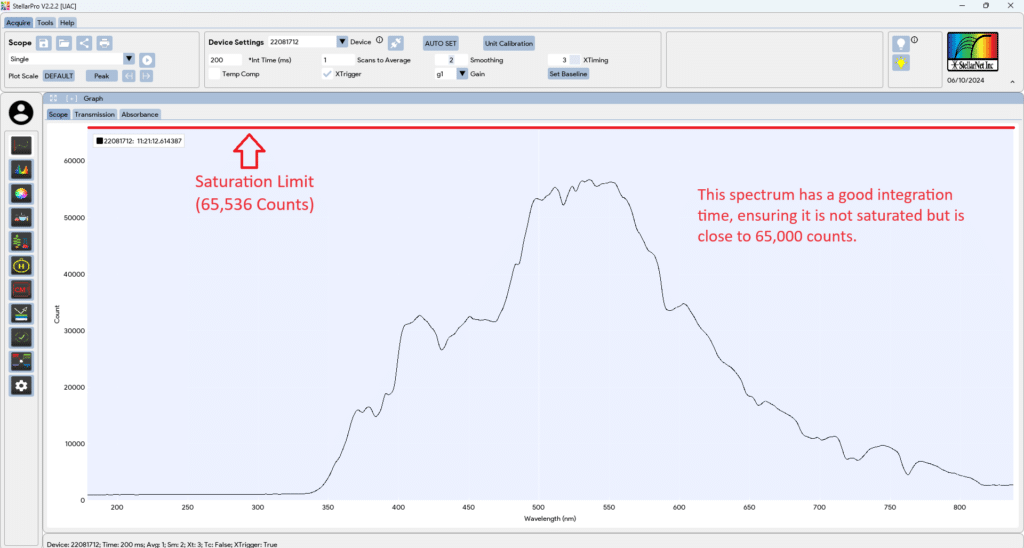
- In Acquire toolbar, set the integration time so that your spectrum is not saturated but as close to 65,000 counts as possible. Enter the desired time in the integration time input box, then click on the “Int Time (ms)” button next to the input textbox to apply the entered time. The goal is to maximize your signal in SCOPE mode. You want to adjust your integration time until the spectrum fills most of the SCOPE graph (65,000) without saturating. This is also the point at which you should adjust the number of scans to average (more scans averaged will increase accuracy, but will take more time for each reading). You can also add smoothing controls at this time in the Device Settings block. A pixel box car set to 3 and averaging set to 5 often gives nice results.
- Turn off the light source, then left-click on the ‘Dark Reference’ button,
 or
or  , in the toolbar at the top right of the screen. You will see your baseline drop to zero.
 - Turn on the light source with the reflectance standard in place, then left-click on the yellow light bulb icon
 in the toolbar at the top of the screen to take the light reference.
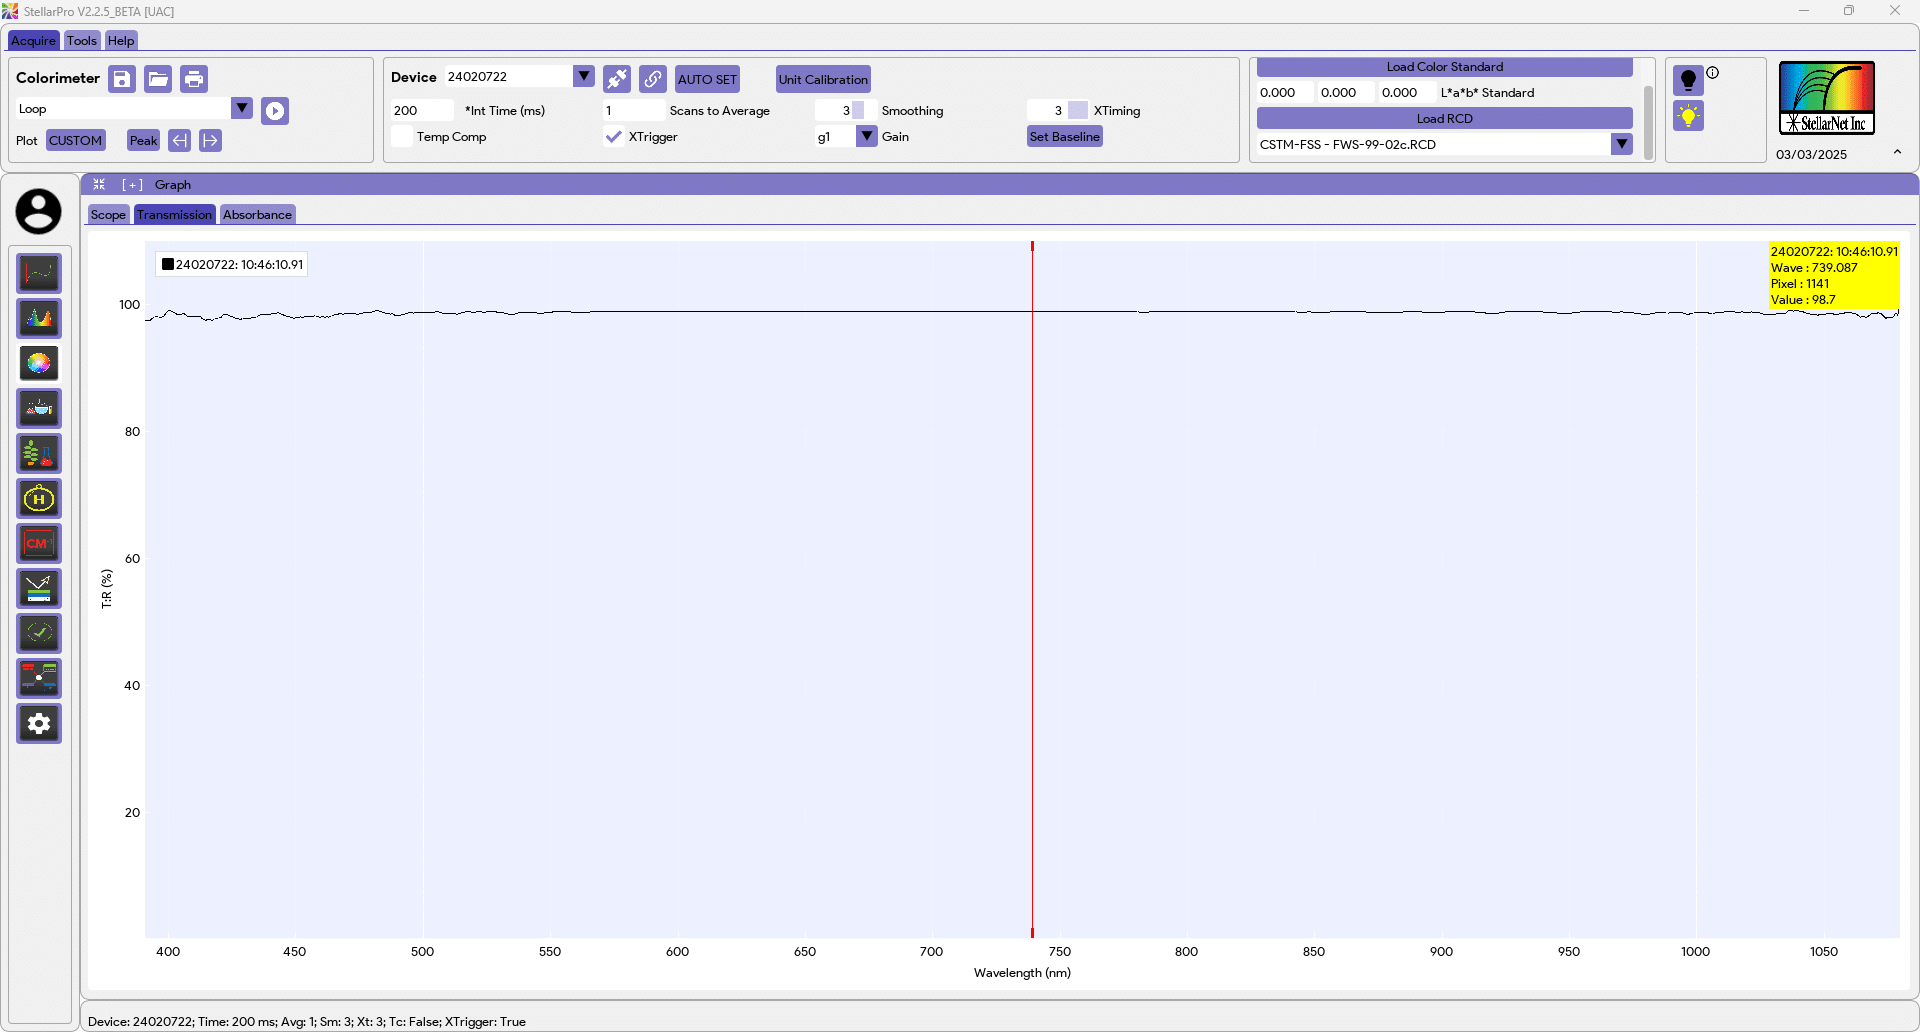
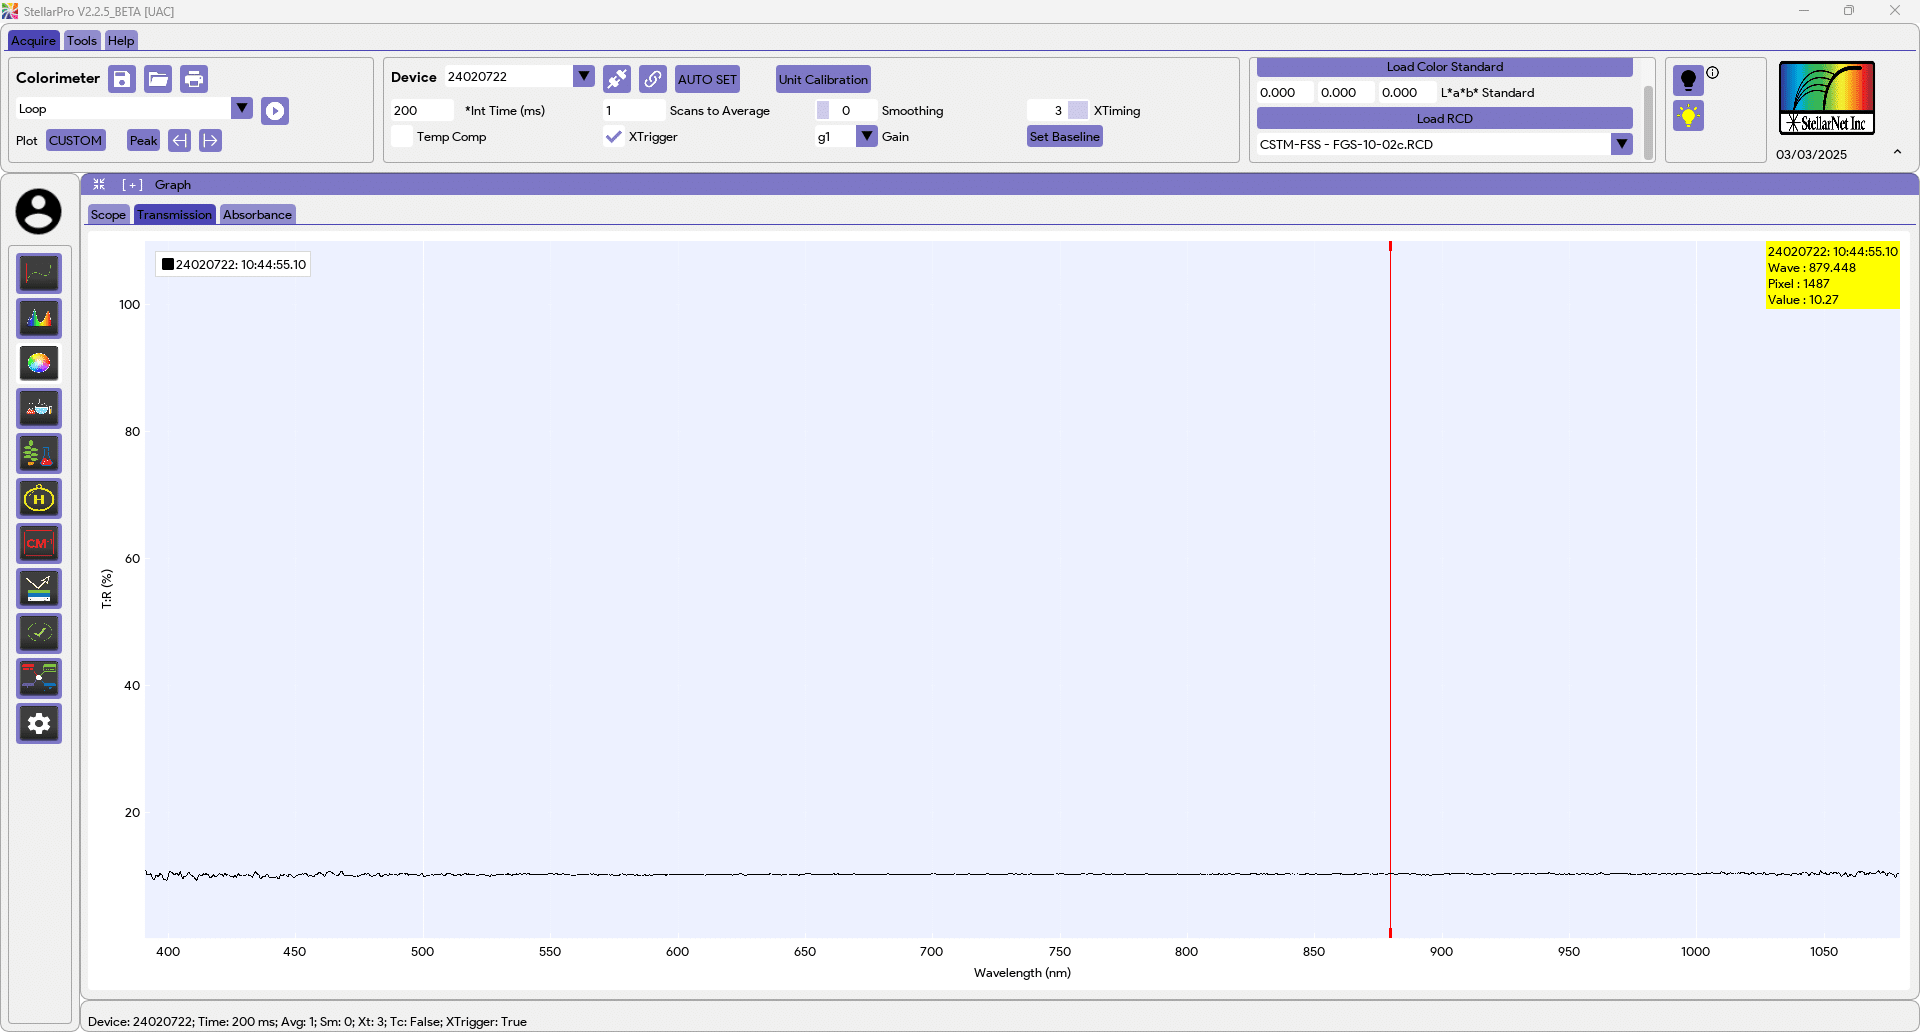
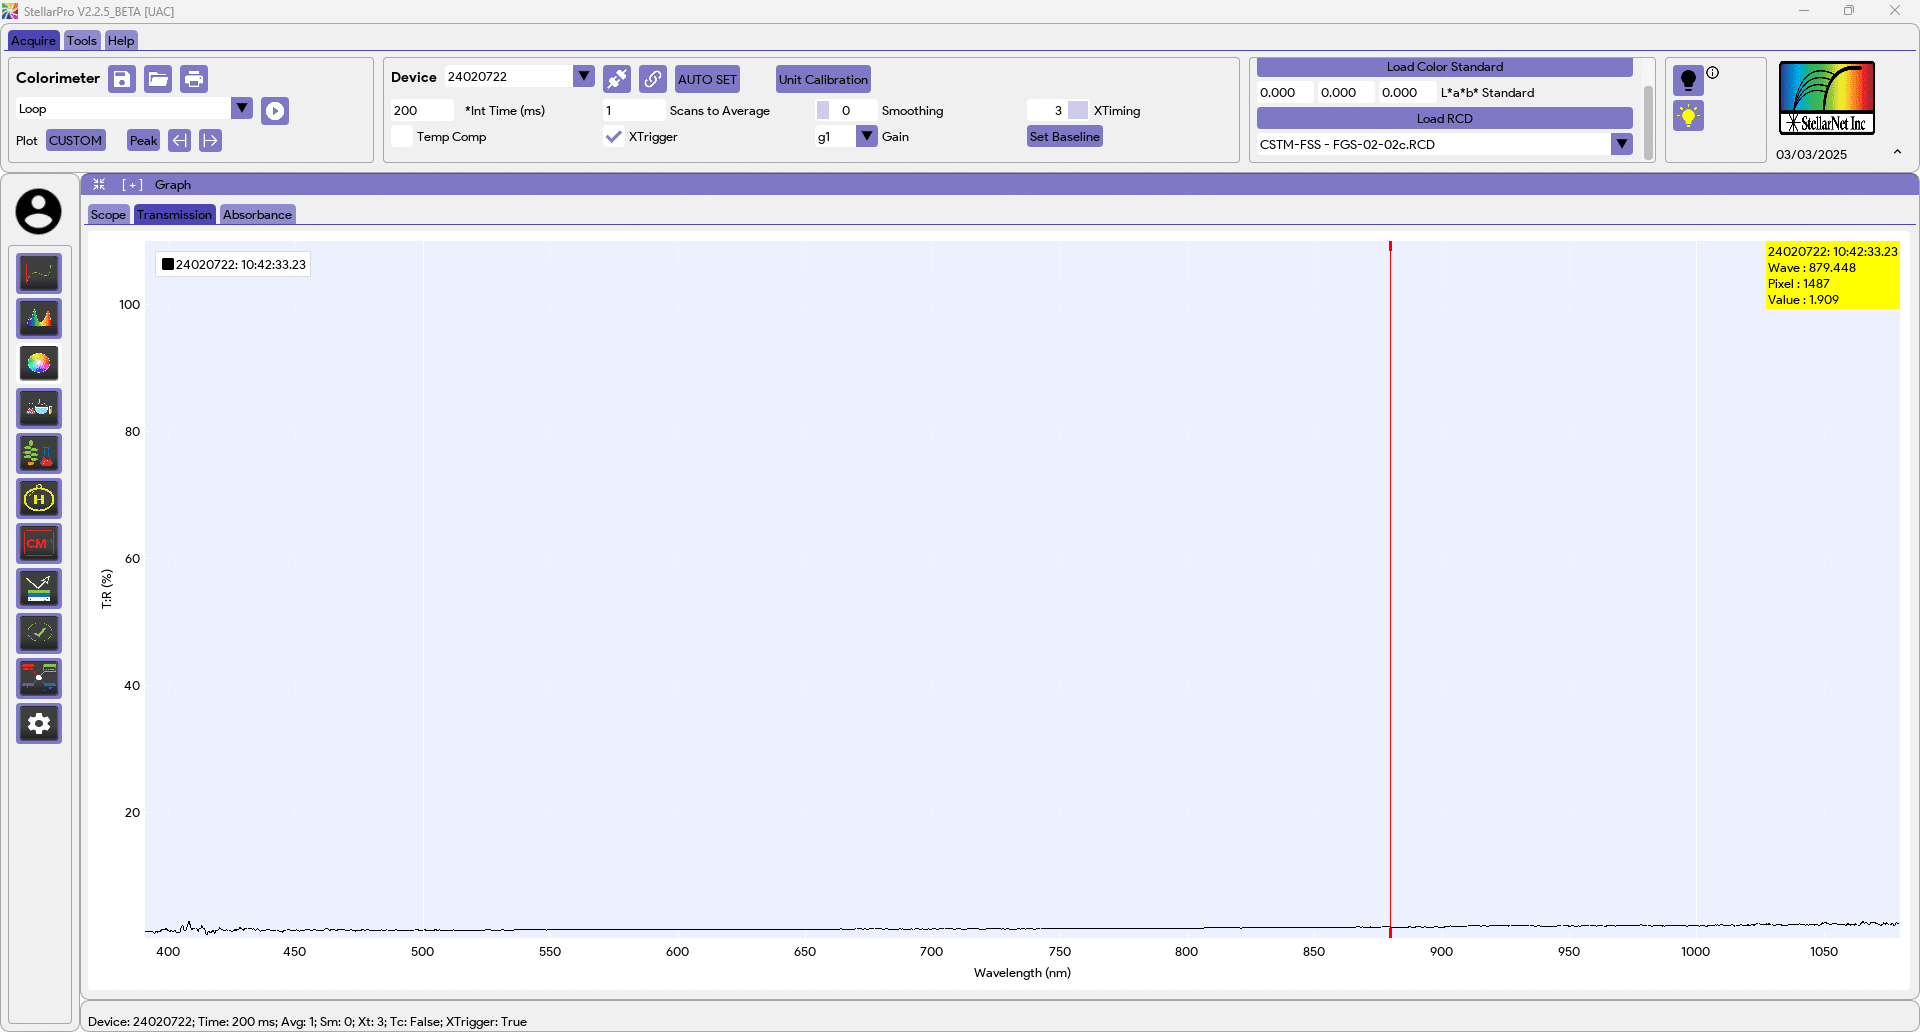
 - Now, in the Transmission graph, you should see a flat line around the percentage based on the acquired reflectance standard. For example:
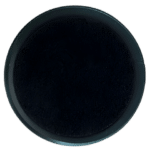
- You are ready to measure the sample by placing the sample under the probe.
- Select the desired data collection mode
 and press the capture icon
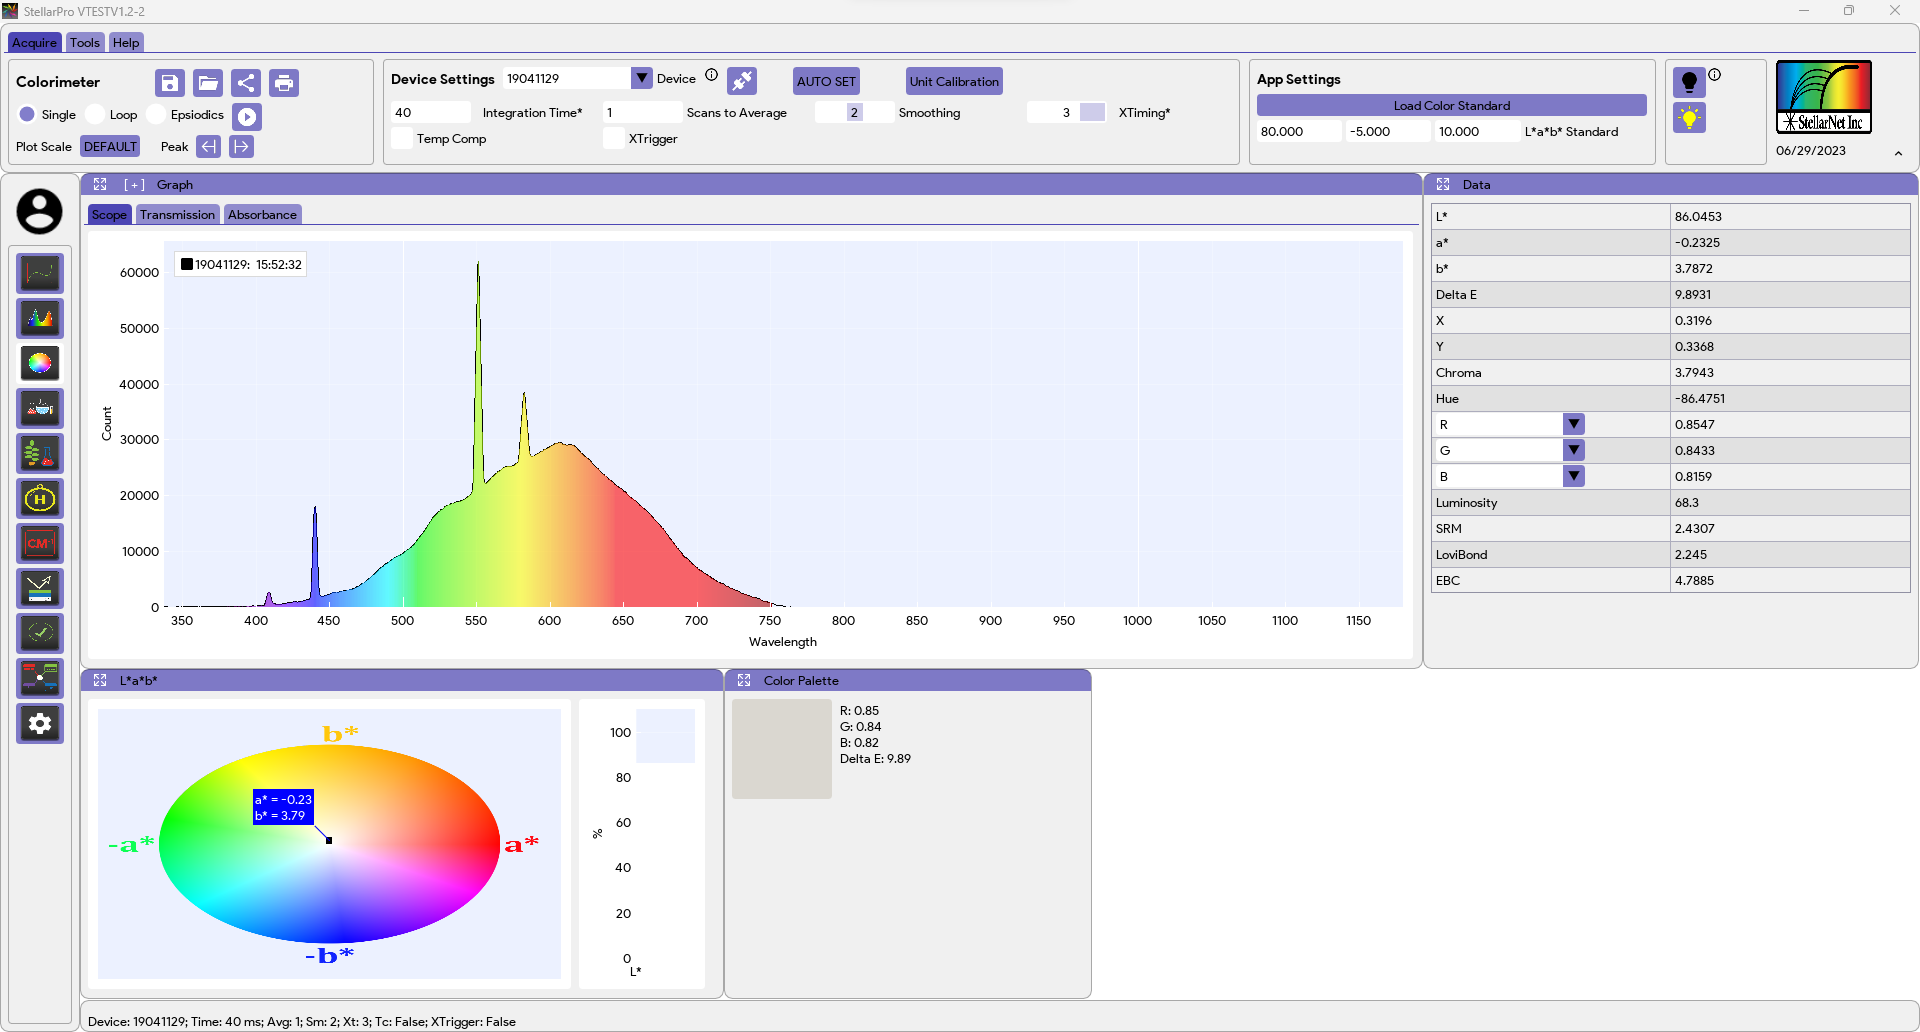
  to start the acquisition. Colorimetric values will be displayed in the Data, Lab*, and Color Palette windows.
 .
.
 or
or  , in the toolbar at the top right of the screen. You will see your baseline drop to zero.
 in the toolbar at the top of the screen to take the light reference.
 and press the capture icon
  to start the acquisition. Colorimetric values will be displayed in the Data, Lab*, and Color Palette windows.