Why Turkey on Thanksgiving? These tasty birds are large enough that they can feed a table full of hungry family, and unlike chickens or cows, they don’t serve much utilitarian purpose like laying eggs or making milk. Since the turkey is native to North America – it is the perfect food to serve on this national holiday celebrated in the USA!
To celebrate Thanksgiving the StellarNet team has put together a fun application note measuring Turkey Fat content using near-infrared spectroscopy.
Introduction
Meat products are typically considered luxury dietary items whether consumed in a processed or raw form. For this reason there is continued interest in measuring meat quality and improving the efficiency of meat processing.
There is a large variability of types of meat cuts as well as biological variations among animals. The ability to visually inspect or estimate fat content in meats can be trained to some extent; however, is substantially subject to drift after the end of a training period (1). Fat, moisture, and protein are some of the major constituents of meat products which near-infrared spectroscopy (NIRS) can detect. Often these components have direct or indirect relationships with each other in different types of meat products. Thus many predicted meat quality properties are also based on their ratios. Fatty acid concentration, added NaCl, and tenderness are some minor components and qualitative properties of meats often predicted using NIRS.
Here’s some interesting turkey trivia that might surprise you:
- Wild turkeys can fly, but domestic turkeys cannot.
- Turkeys can run up to 20 miles per hour.
- The long, loose skin that hangs down on a turkey’s neck is called a “wattle.”
Method
A StellarCASE-NIR system with RFX-3D reflectance fixture was utilized to demonstrate the efficacy of NIRS to predict fat content in ground poultry. Spectra were captured with the SpectraWiz software (Figures 1, 2).
Low fat content (1%) and high fat content (8%) ground turkey was purchased at the local grocery store and subsequently mixed together in ratios to obtain 1-8% ground turkey patties. Each meat patty was mixed for approximately 10 minutes each to ensure complete homogenization and uniform distribution throughout the patty. Fat content was determined by using provided grocery store package information and mixing into uniformly mixed patties (Figure 3).
A calibration to relate reflectance spectra to fat content was developed using the ChemWiz Analyzer Development Kit software (ChemWiz ADK). The ChemWiz ADK is an add-on software with specific functions for building multivariate calibrations. The ChemWiz ADK was utilized to explore various mathematical preprocessing steps to improve the calibration performance.
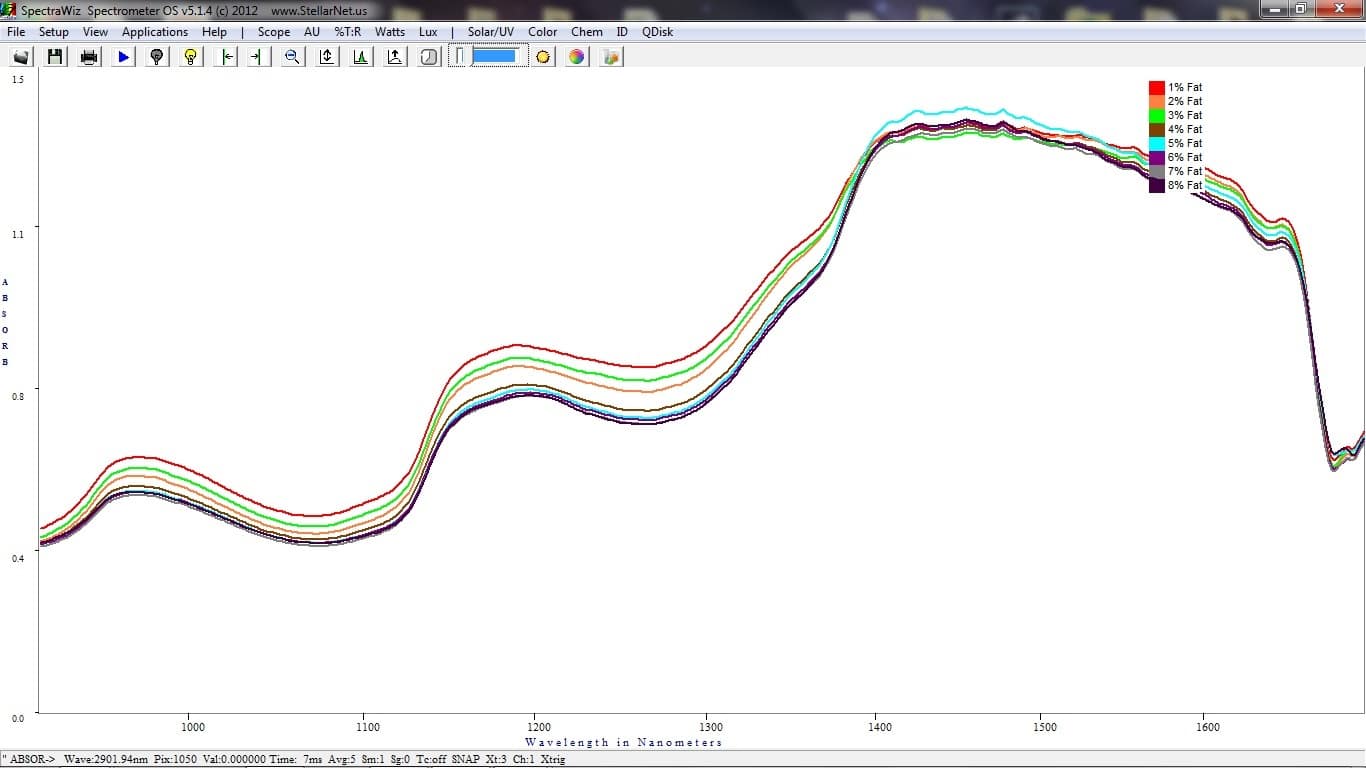
Figure 1. Reflectance Spectra of Turkey Patties
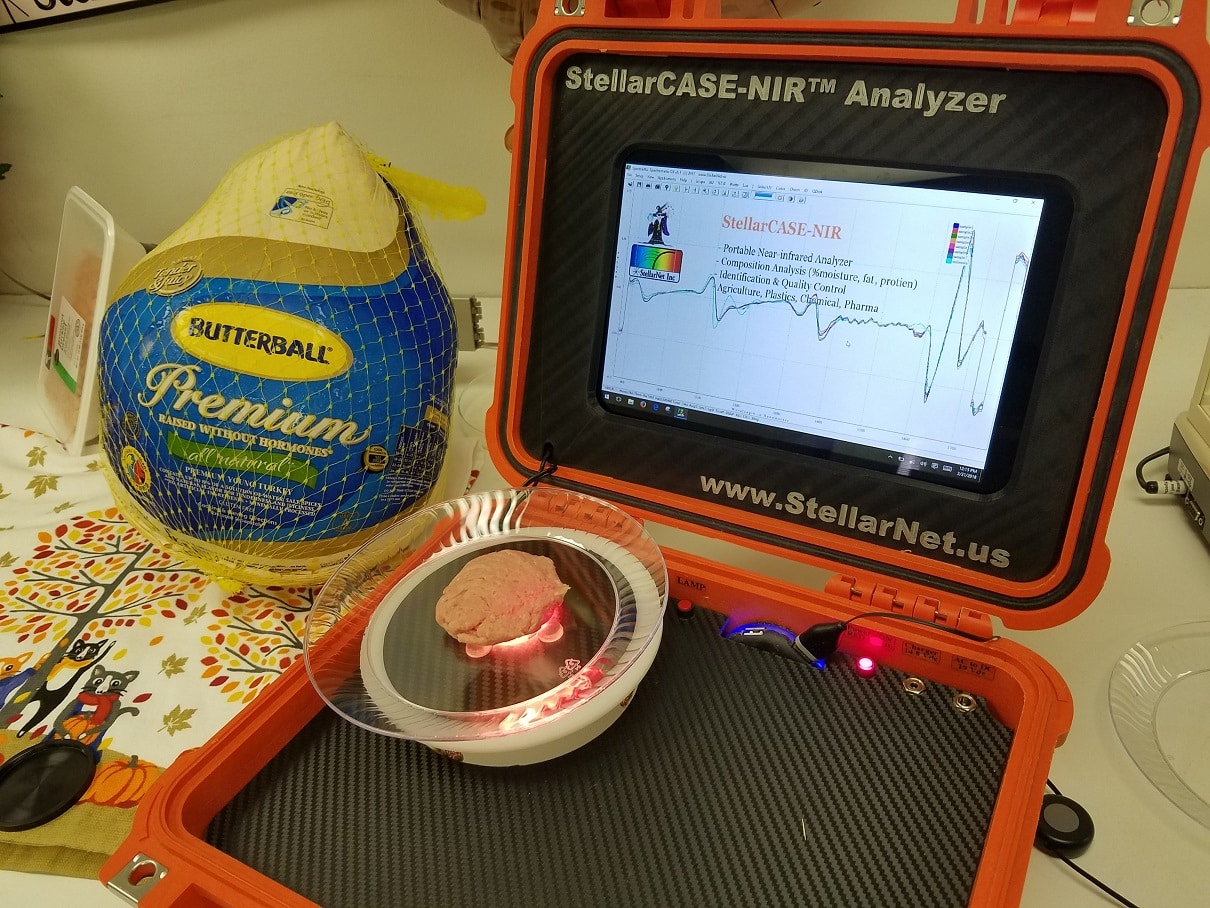
Figure 2. StellarCASE-NIR system with 3D field of view reflectance fixture.
Ideally, variability in spectra would only depend on the variable of interest. However, many factors influence how the light is absorbed, scattered, and reflected by the sample.
One such variation is optical path length. In our experiment, variations in the thickness of the petri dishes could have had an impact the spectra. Therefore, a standard normal variate and scattering correction was explored (Figure 4).
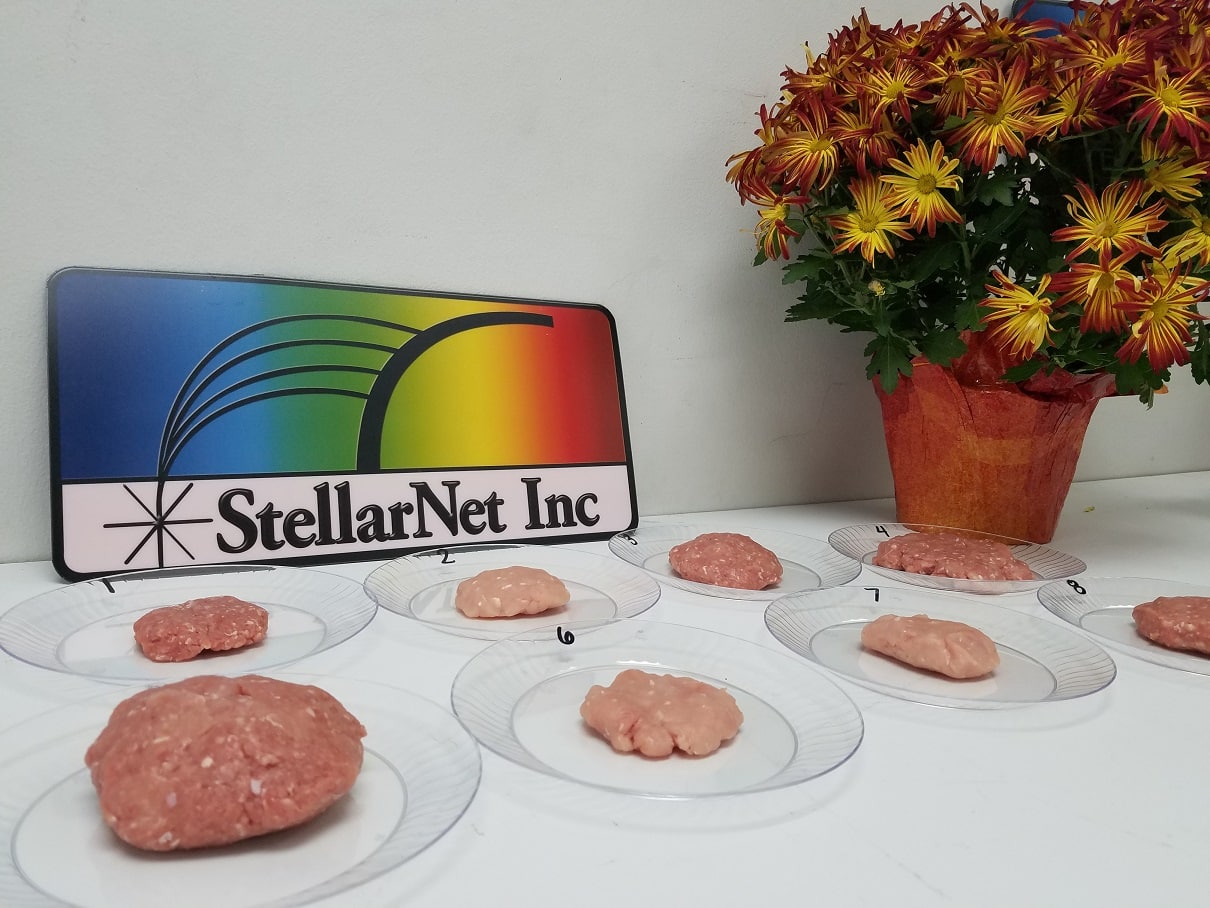
Figure 3. Patties ready for measurement
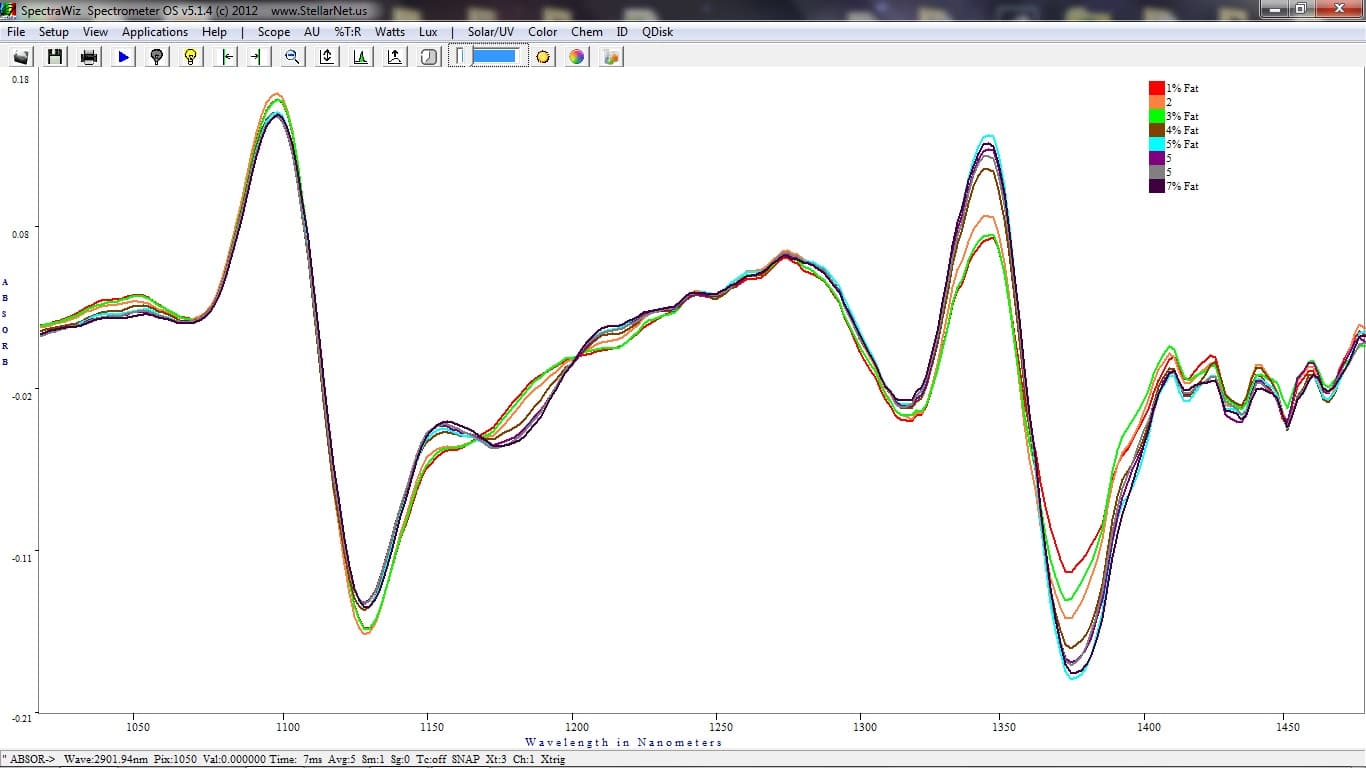
Figure 4. Scatter correction, SNV, mean centering, and second derivative preprocessing algorithms were used in our feasibility calibration model.
Additionally, baseline shifts are common in spectroscopy. The spectral baseline can shift due to variations in output from the light source and drift in the detector. By taking the derivative of the spectra, these effects can be minimized as the slope of a curve is not affected by changes in the baseline (Figure 4).
Next we need to determine which wavelengths should be used for predictor variables. The spectra that we have collected contain many variables that could be used for prediction. Furthermore, the reflectance measured at each wavelength is not completely independent from adjacent wavelengths. Spectroscopists utilize a calibration technique known as partial least squares regression (PLSR) to solve these problems. PLSR constructs new predictor variables, known as components, as linear combinations of the original predictor variables that are then compared to the response variable to select which components are most promising for regression.
Finally, we need to assess the performance of our model. The performance of the calibration model is ideally evaluated by predicting fat content of an independent set of ground turkey patties. Since we have only scanned 10 mixed patties we take an admittedly less conservative approach known as cross-validation to estimate performance. Cross-validation estimates the efficacy of a model by building a successive set of calibrations where one or more samples are left out and predicted. Summary statistics such as root mean standard error of cross-validation (RMSECV) and coefficient of determination are determined by these validation sets.
Results
A calibration model was constructed with an RMSECV of 1.3 % Fat and an r2 of 0.93. All aforementioned preprocessing algorithms were used and a graph of predicted to measured fat concentration plotted in Figure 7. Using the SpectraWiz software our new model can be loaded and unknown samples can be run in real-time.
In addition to the work shown here, the ChemWiz ADK provides extended functions and plots to assess the model and the influence that each predictor variable and data point has on the model.
Conclusion
This proof of concept demonstrates the efficacy of NIRS method to predict the fat content of ground poultry samples. This model is directly loadable into many of StellarNet’s software platforms for research and quality control applications. Likewise, using our new zAP2, integrated processor with wifi and other external communication protocols, models can be loaded directly into your spectrometer for OEM and industrial process applications. ContactUs@StellarNet.us for more information.
Sources
Kroeze,J.H.A., G. Winjnaards, P.Padding, M.R.I Linschoten, and B. Theelen-Uijtewaal. 2000. Training for more accurate visual fat estimation in meat. Meat Sci. 54:319-324
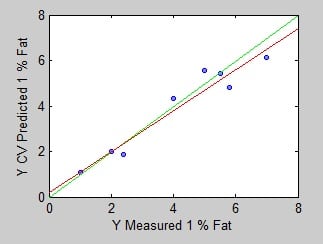
Figure 7. Predicted vs.actual fat content

Lasting until the end of 2018, StellarNet is offering incredible savings on all dual spectrometer systems that include a UV-VIS and NIR spectrometer. Read more…