What is the Correlated Color Temperature (CCT) of a light source?
The correlated color temperature is another way to describe a light source’s color point on the 1932 CIE chromaticity diagram. It compares the color to that of a blackbody source heated to a certain temperature. For example, light bulbs are described as 2700K, 5000K,...What is Episodic Data Capture?
Episodic Data Capture is a tool in the SpectraWiz software that can be used to capture spectra over a certain time period. It can be found under the “Setup” menu. For example, it could be set up to capture a spectrum every second while a reaction is occurring to...What is Chroma?
Chroma describes how pure, or monochromatic, a color is compared to a white surface with the same illumination. For example, if a white surface is illuminated with 0.1W m-2 nm-1, the irradiance spectrum will also show 0.1W m-2 nm-1 at all visible wavelengths...What is a Data Log?
In the SpectraWiz software, the data log is a utility that records instantaneous samples every time you click a button that says “Save Sample.” It stores all of them, with timestamps, in a common file. Data stored in the log is not deleted unless the “Clear” button is...What are the CIE XYZ tristimulus values?
The human eye has three types of cone cells that are stimulated by different wavelengths of light, leading to the perception of color. Colors can be quantified based on how much they stimulate the three cones. These are called the LMS tristimulus values. However, the...
Introducing our new Applied Spectroscopy Division
New Handheld Raman!
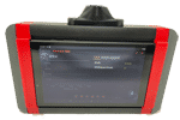
New! ChemWiz-ADK Handheld NIR Spectrophotometer with on board chemometrics and spectral matching!
Read More
Check out our SpectroChemistry Systems for UV-VIS and Fluorescence Applications
Learn More
New Spectrometer Python Application Driver
for Windows, Linux, RasPi, Mac
Check it out!
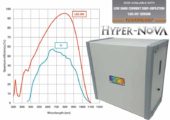
HYPER-Nova Highest Performance Raman Spectrometer
Learn More