Raman Spectroscopy in the Classroom
Using Raman Spectroscopy to Detect Art Forgeries
Exploring Chemical Bonding Using Raman Spectroscopy
Modular Raman Systems
View Sample Spectra
532 – 785 – 1064
Portable Analyzers
StellarCASE-Raman
Introduction to Raman Spectroscopy
Raman spectroscopy is one of the fastest growing segments in the spectroscopy market due to its wide range of applications combined with ever decreasing equipment cost. The Raman effect, which arises from the inelastic scattering of photons off of molecules, allows for the vibrational energy of molecular bonds to be measured in a non-contact and non-destructive manner. Because every molecule has a unique bond structure, this provides a molecular fingerprint allowing for the identification and classification of a wide range of analytes. Like all techniques, Raman does have its limitations as well, and it is important to lay the biggest one up front: the Raman effect depends on the presence of covalent bonds. As a result, Raman cannot be used to measure salts (ionically bound molecules) or metals. For these types of materials it is best to use an atomic method such as laser-induced breakdown spectroscopy (LIBS).
Theory of Raman Scattering
Since the Raman effect is a result of light inelastically scattering off of molecular bonds, the scattered photons will either gain or lose energy equal to the vibrational energy of the bond which results in a shift in wavelength. Therefore, when a highly monochromatic excitation source (e.g. a laser) is directed onto the sample, a spectrometer can be used to measure the scattered light and produce a Raman spectrum where each peak corresponds to a different vibrational mode of the sample. Since the Raman shift is directly related to the difference between the excitation source wavelength and the scattered lights wavelength, it is critical that a highly stable laser is used for this application. The laser’s center wavelength, power, and spectral linewidth all correlate directly to the quality and repeatability of the Raman spectrum. For example, if the center wavelength shifts, the peak positions will not be repeatable. If the power fluctuates, then the peak heights will not be repeatable, and if the linewidth is broader than the resolution of the spectrometer, the peak widths will be artificially broadened.
Using the Hooke’s law approximation of a diatomic molecule where K represents the bond strength and m represents the reduced mass of the two atoms the following relationship can be derived:

From this equation, it is clear to see that the frequency of the vibrational mode (and therefore its energy) is directly proportional to the bond strength and inversely proportional to the reduced mass. As a result, Raman spectra are able to clearly differentiate not only between bonds of different elements but also between single/double/triple bonds, aromatic/aliphatic rings, and various crystal lattices consisting of the of the same atoms. For example, benzene (C6H6) and cyclohexane (C6H12) are both rings of six carbon atoms but because benzene consists of alternating single and double bonds it vibrates at a much higher frequency (~1,000 cm-1) than and cyclohexane (~800 cm-1) which is made up exclusively of single bonds. When this is extended to more complicated molecules such as acetaminophen (C8H9NO2) the measured spectrum can be cross-correlated with a library of known spectra to verify the identity of the sample.
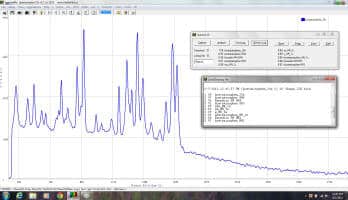
Figure (1) Raman-HR-TEC 785nm Raman spectra of Acetaminophen displaying library search hit of the brand name Tylenol as the closest match.
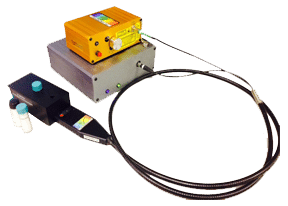
Figure (2) Example Raman setup using Raman-HR-TEC 785nm Raman spectrometer, Ramulaser 785, and Raman-Probe-785.
Example Set-up
The spectrum in Figure 1 was collected using the Raman-HR-TEC-785 spectrometer from StellarNet, which is configured specifically for the measurement of Raman spectrum using the Ramulaser 785nm laser excitation source with a spectral resolution of 4 cm‑1 and spectral range from 200 cm-1 to 2750 cm-1 (798nm to 1001nm). The Ramulaser 785 is a wavelength stabilized multimode fiber coupled laser source which provides an adjustable power output up to 499mW while maintaining spectral stability and narrow linewidth, less than 0.2nm or 3.2cm-1 FWHM. The laser is FC/PC coupled to the Raman-Probe-785 which focused the laser light onto the sample and then collected and filtered the Raman scattering coupling it to the spectrometer via a second SMA 905 terminated fiber optic cable. Figure 2 above shows an example set-up.
Final Thoughts
In addition to the traditional 785nm excitation system depicted above, there is a wide range of other options available depending on the sample under investigation. StellerNet offers systems for 405nm, 532nm, 633nm, 785nm, 830nm, and 1064nm Raman spectroscopy. Additionally, StellerNet offers a wide range of sampling accessories including vial holders and microscopy adaptors. To find out how StellerNet can provide you with the ideal Raman solution for your application, don’t hesitate to contact one of our applications specialists today.