Introduction
If you’ve driven through the mid-western United States, you’ll have noticed that corn is an important and prevalent crop. Corn covers about 90 million acres of farmland in the U.S. and accounts for about two-thirds of global grain trade.
The food, biochemical and materials industries have standardized on corn as a raw material for their products. U.S. No. 2 corn–a designation given by the United States Department of Agriculture Grain Inspection Service–sustains our livestock, food, biofuel and biomaterial industries. As an alternative to No. 2 corn, open pollinated varieties and alternative hybrids can lead to significant chemical variation. In fact, some bakers, brewers and malters are exploring genetic variations of corn that could give them an edge in their trade.
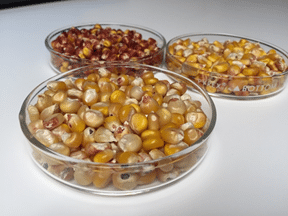
Figure 1. Visual variability in corn samples
investigated in this study.
Low-cost near-infrared reflectance spectroscopy (NIRS) could be a useful tool for anyone who wishes to explore or verify the chemical properties of corn. As a tool for predicting chemical properties, NIRS is particularly sensitive to organic molecules that contain C-H, O-H, and N-H. And, as such, is a great technique for prediction of the chemical properties of corn (Workman and Shenk, 2004). Here we explore the basic gross chemical composition, including starch, protein, fat, sugar and fiber, in corn. However, the same method could be utilized to reveal compositional characteristics that are unique to your trade.
NIRS isn’t limited to basic chemical analysis. Processes driven by complex chemical and physical interactions within a biological material can be gleaned from the technique. In fact, NIRS has been utilized to predict end-product yields of both milling as well as biological processes such as fermentation and malting (for a review see Delwiche, S.R., 2004; Dyer, 2004). NIRS is particularly valuable for predicting complex quality attributes that are difficult to describe or measure with chemical assays.
Method
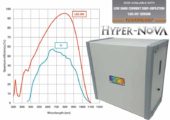
A StellarCASE-NIR with internally mounted RFX-3D reflectance fixture was utilized to demonstrate the efficacy of NIRS to predict gross chemical composition of corn. Spectra were captured with the SpectraWiz software (Figure 2).
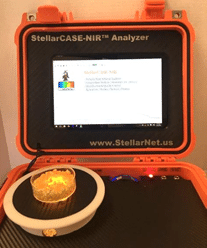
Figure 2. StellarCASE-NIR with corn sample.
Corn samples were obtained from a hybrid trail in an effort to maximize chemical variability. Twenty ears were hand harvested, representing five hybrids.
Each ear was shelled and placed into a 100-mm diameter glass petri dish, scanned five times, mixed and scanned five more times with the spectrometer system. Samples were then packaged and sent to a commercial laboratory for moisture, starch, crude protein, fiber, and fat and sugar reference data.
A calibration to relate reflectance spectra to dry matter content was developed using MATLAB and ChemWiz Application
Development Kit (ADK). ChemWiz ADK is a collection of functions for building multivariate calibrations.
The ChemWiz ADK was utilized to explore various mathematical pre-processing steps to improve the calibration performance and optimal selection of wavelengths via the partial least squares regression (PLSR) method.
Finally, we need to assess the performance of our model. The performance of thecalibration model is ideally assessed by predicting chemical makeup of an independent set of corn samples. Since we have only scanned twenty corn samples we take an admittedly less conservative approach known as cross-validation to estimate performance. Cross-validation estimates the efficacy of a model by building a successive set of calibrations where one or more samples are left out and predicted. Summary statistics such as root mean standard error of cross-validation (RMSECV) and coefficient of determination (r2 ) are determined by these validation sets.
Results
Figure 1 summarizes the variability observed in our corn samples. Having a calibration set that encompasses the variability that you want to predict is essential.
Variability also includes chemical and physical aspects of the samples that you do not intend to predict but do have an influence on the spectra. For example, particle size and temperature commonly influence the spectra received by the instrumentation but are not generally predicted.
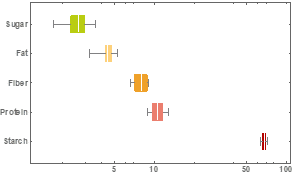
Figure 1. Compositional variability (percent dry matter %DM) of calibration dataset for gross chemical composition of corn, including sugar, fat, fiber, crude protein and starch.
Our samples show good variability in sugar, fat, fiber and protein when compared to laboratory averages. This variability will help us build a robust NIRS prediction model. Calibration models were constructed for each chemical component. The most promising model was for protein; however, it is clear that our dataset is incomplete and would require additional samples to determine the efficacy of the technique for sugar, starch, fiber, and fat. The RMSECV for protein was of 0.71 %DM and an r2 of 0.72. Both derivative and auto scale math treatments were employed (Figure 2).
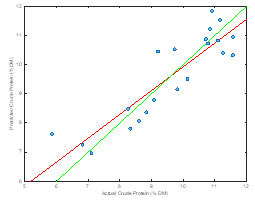
Figure 2. Predicted versus actual for a NIRS calibration model to predict crude protein.
Conclusion
Several math pretreatments and PLSR models were explored to predict gross chemical composition of undried and unground corn samples. The protein model was the most successful; however, more data would be needed to assess both this model and the models for sugar, starch, fiber and fat.
Sources
Workman, J., and J. Shenk. 2004. Understanding and Using the Near-Infrared Spectrum as an Analytical Method. In: C. A. Roberts, J. Workman Jr., J. B. Reeves III, editors, Near-Infrared Spectroscopy in Agriculture, Agron. Monogr. 44. ASA, CSSA, SSSA, Madison, WI. p. 3-10.
Delwiche, S. R. 2004. Analysis of Small Grain Crops. In: C. A. Roberts, J. Workman Jr., J. B. Reeves III, editors, Near-Infrared Spectroscopy in Agriculture, Agron. Monogr. 44. ASA, CSSA, SSSA, Madison, WI. p. 269-320.
Dyer, D. J. 2004. Analysis of Oilseeds and Coarse Grains. In: C. A. Roberts, J. Workman Jr., J. B. Reeves III, editors, NearInfrared Spectroscopy in Agriculture, Agron. Monogr. 44. ASA, CSSA, SSSA, Madison, WI. p. 321-344.

By Matthew Digman, Ph. D.
Assistant Professor of Agricultural Engineering
Technical Staff Writer