NON-DESTRUCTIVE VIS-NIR REFLECTANCE SPECTROMETRY FOR RED WINE GRAPE ANALYSIS –July 2011
Michael Fadock –Thesis, University of Guelph
A novel non-destructive method of grape berry analysis is presented that uses reflected light to predict berry composition. The reflectance spectrum was collected using a diode array spectrometer (350 to 850 nm) over the 2009 and 2010 growing seasons. Partial least squares regression (PLSR) and support vector machine regression (SVMR) generated calibrations between reflected light and composition for five berry components, total soluble solids (°Brix), titratable acidity (TA), pH, total phenols, and anthocyanins. The reflectance data was decomposed using principal component analysis (PCA) and independent component analysis (ICA). Regression models were constructed using 10×10 fold cross validation subject to smoothing, differentiation, and normalization pretreatments. All generated models were validated on the alternate season using two model selection strategies: minimum root mean squared error of prediction (RMSEP), and the „oneSE heuristic…Diffuse reflectance spectra for the composite berry samples were measured with a portable array spectrometer (Model EPP2000C-100, StellarNet Inc., Tampa, FL, USA) using the SpectraWiz® software supplied by the manufacturer.
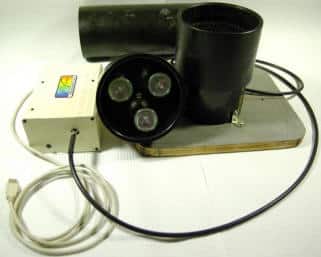
Figure 14: 2009-10 study instrumentation. From left to right: A – Spectrometer, B – Light Source, C – Sample Holder.
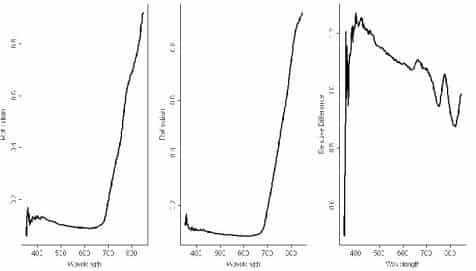
Figure 18 Average spectral reflection for 2009, 2010, and relative difference (left to right). Selected difference features highlighted at 750, 772, 820, and 850nm.