XF Zhang and F Li – Journal of Photochemistry and Photobiology A: Chemistry, Volume 246 (p. 8-15), 2012.
The fluorescence decay of Rhodamine 6G (R6G) became biexponential when chemically derived few-layer graphene (CDG) is present, indicating the occurrence of new emitting species. To reveal the nature of the species, the binding behavior between CDG and R6G was studied by time-resolved, steady state fluorescence, UV-vis absorption methods and AFM. The addition of CDG caused the dramatic change in UV-vis absorption spectrum of R6G. The evolution of isosbestic point revealed that R6G could bind to CDG in different modes. CDG titration also led to the significant quenching of the fluorescence intensity and shortening of the emission lifetime of R6G, but the data does not follow the traditional Stern-Volmer plot. Detailed analysis on absorption and fluorescence data revealed that R6G could bind to CDG and CDG aggregates in different ways to form following complexes: R6Gn-CDG, R6Gn-(CDG)2 and CDG-R6Gn-CDG, respectively. Different from other dye-graphene complex, R6G-graphene complexes are emissive, but three ground state complexes exhibit different fluorescence spectral properties and fluorescence lifetimes. The mechanism that causes R6Gn-CDG to emit differently is also discussed. R6Gn-CDG etc. complexes act as intra-molecular electron donor-acceptor pairs which undergo photoinduced electron transfer (PET) and energy transfer from R6G to CDG upon light excitation. The total rate constant of quenching due to PET and energy transfer is computed and dependent on the binding mode. … 2.2. Instruments and Photophysical Measurements. UV–vis absorption measurements were made with a StellarNet BLACK Comet C-SR diode array miniature spectrophotometer connected to deuterium and halogen lamp by Optical fiber in 10 mm quartz cuvettes.
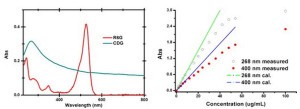
Fig. 2. The UV–vis absorption spectra of CDG and R6G in aq. solution (left) and the plot of CDG absorbance against CDG concentration (right).
![Fig. 5. Change of fluorescence spectra of R6G (3.6 μM) with increasing concentration of CDG. Emission was measured with excitation at 470 nm in aq. phase. Inset top: nonlinear relationship between intensity quenching (F/F0) vs. [CDG], F0, Fis the integrated fluorescence intensity in the absence and presence of CDG, respectively. Inset bottom: normalized emission for R6G when [CDG] is 0 and 22.2 μg/mL, respectively.](https://www.stellarnet.us/wp-content/uploads/Fig-5-Interaction-of-graphene-with-excited-and-ground-state-Rhodamine-revealed-by-steady-state-and-time-resolved-fluorescence-300x227.jpg)
Fig. 5. Change of fluorescence spectra of R6G (3.6 μM) with increasing concentration of CDG. Emission was measured with excitation at 470 nm in aq. phase. Inset top: nonlinear relationship between intensity quenching (F/F0) vs. [CDG], F0, Fis the integrated fluorescence intensity in the absence and presence of CDG, respectively. Inset bottom: normalized emission for R6G when [CDG] is 0 and 22.2 μg/mL, respectively.