Why Flamingos Are Pink: A Spectral Story of Carotenoids
When people see a flamingo, the first question is usually simple: why pink? The answer is surprisingly chemical, and even more surprisingly measurable.
Flamingos are not born pink. In fact, they start life with grayish feathers. Their iconic color develops over time through diet, specifically from pigments called carotenoids. From a spectroscopy standpoint, this is where things get interesting. These are not just “colorful molecules.” They are compounds with very specific light absorption behavior that we can measure directly using UV-Vis spectroscopy.
In this note, we will walk through how flamingos become pink, how light interacts with their pigments, and how spectroscopic tools help us understand the process in a quantitative way. We will also bring this concept home with a local example from Tampa Bay’s own flamingo habitat at Sunken Gardens in St. Petersburg.
The Source of the Color: A Diet Written in Pigments
Flamingo coloration begins far below the bird itself, in microscopic life.
In wetland and coastal ecosystems, algae and cyanobacteria produce carotenoids as part of their normal biology. These pigments serve protective roles for the organisms, especially in managing light exposure and oxidative stress.
The chain continues from there:
- Algae produce carotenoids
- Brine shrimp and small crustaceans consume the algae
- Flamingos consume the shrimp and concentrate the pigments over time
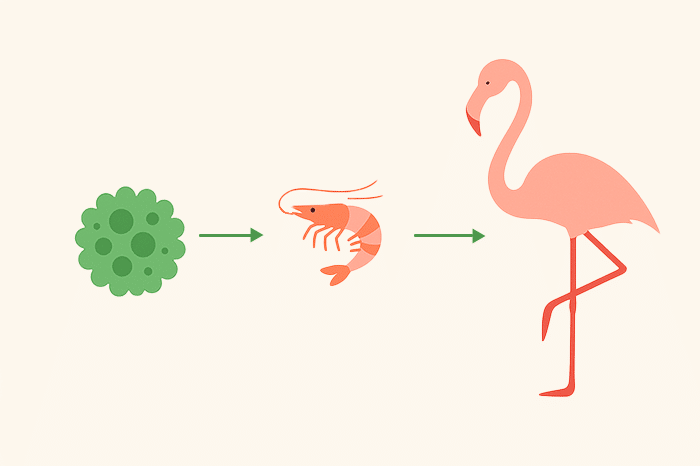
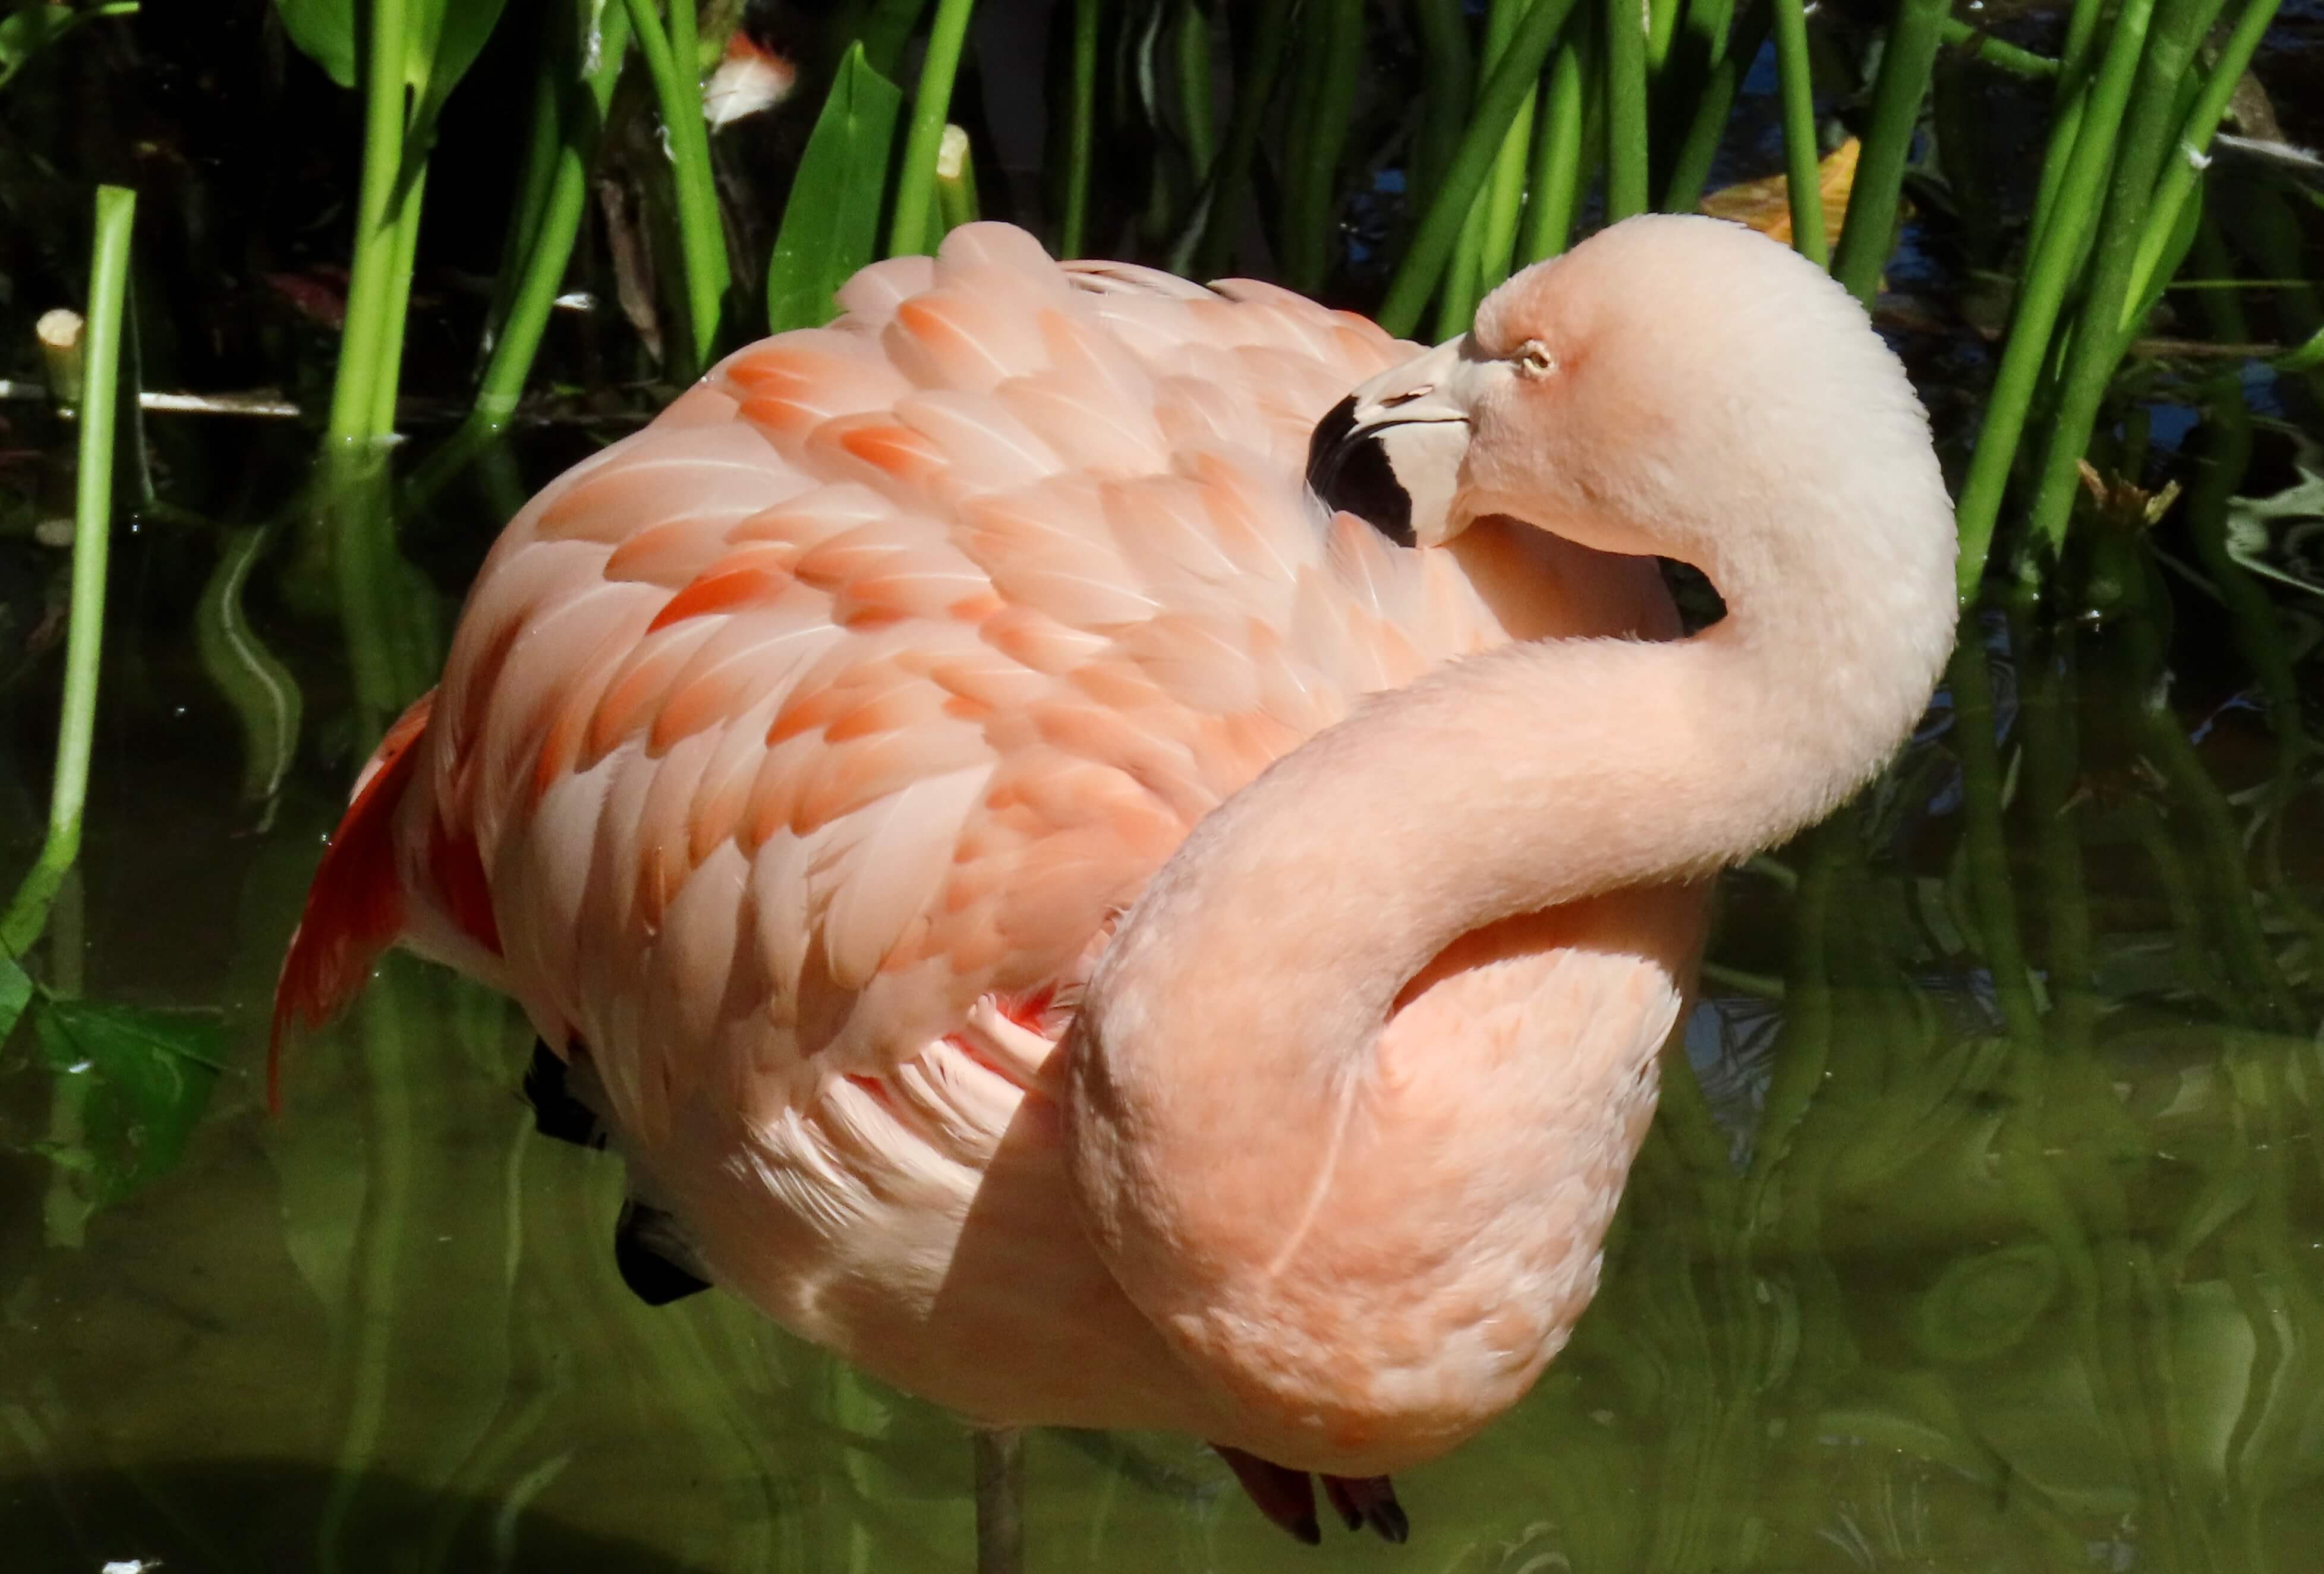
As the pigments accumulate in flamingo tissues, especially feathers, the visible result is the soft pink to deep coral coloration we associate with the species. From a spectroscopist’s perspective, this is a classic example of a natural “signal amplification” system. A faint chemical signature in microorganisms becomes a visually dominant trait in a large animal.
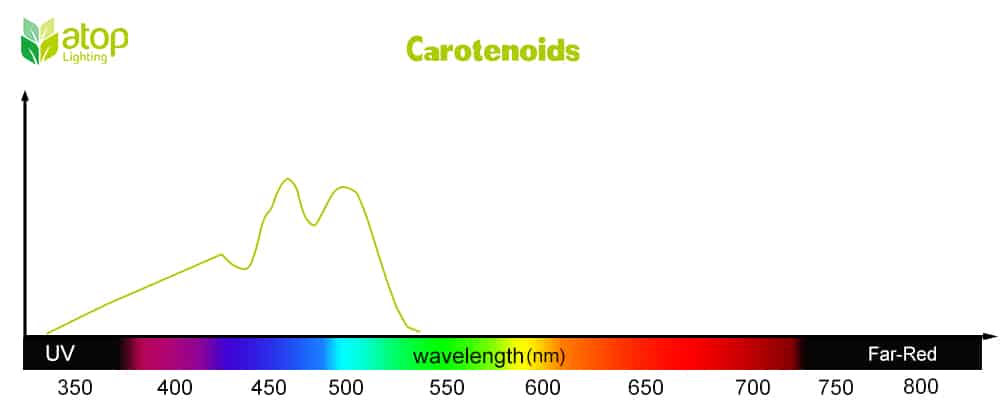
Figure 1. Example UV-Vis absorption spectrum of carotenoid pigments showing strong absorption in the blue region of the visible spectrum (approximately 400–500 nm). [Source]
How Carotenoids Shape Light: The Physics Behind Pink
Measuring Nature’s Color: From Feathers to Field Data
Once we understand the chemistry and optics, the next step is measurement.
UV-Vis spectrometers allow researchers to quantify carotenoid concentration in multiple ways:
- Extracted pigment analysis from algae or shrimp samples
- Reflectance measurements from biological tissues such as feathers
- Comparative studies across habitats with different nutrient conditions
This is where tools from StellarNet become particularly useful. Portable and lab-based spectrometers allow researchers and educators to take measurements directly in controlled environments or even in the field, bridging the gap between ecological observation and chemical analysis.
Instead of simply noting that flamingos are “more pink” in one location than another, spectroscopy allows us to ask a deeper question: what is changing in the ecosystem to produce that difference?
Recent studies support this approach by showing that carotenoid content changes depending on light conditions such as intensity and wavelength. In one peer-reviewed study on purple phototrophic bacteria, lower light levels were shown to increase carotenoid production and shift the types of carotenoids present.
In this work, a StellarNet BLUE-Wave Spectrometer was used to measure light conditions during the experiments and support the analysis of pigment changes in microbial systems (Grassino et al., 2025). The study also demonstrated that spectroscopy can help identify individual carotenoids like lycopene and rhodopin, rather than only measuring total pigment levels.
This reinforces how spectroscopy helps us understand how biological color forms and changes with the environment.
Local Perspective: Sunken Gardens and Living Spectra
A great way to bring this concept to life is just a short drive away. At Sunken Gardens in St. Petersburg, visitors can observe live flamingos in a carefully maintained botanical environment. While it may look like a purely aesthetic experience, it is also a living demonstration of the principles discussed here.
The intensity of flamingo coloration at Sunken Gardens reflects diet management, environmental control, and biological accumulation of pigments over time. In a sense, it is a real-world showcase of how consistent nutritional inputs translate into stable spectral signatures in living organisms.
For educators and curious visitors, it becomes an easy entry point into a larger idea: what we perceive as color is often just the visible surface of a deeper chemical story.
Conclusion
Flamingo pink is not just a visual trait. It is the end result of a biological and chemical pathway that begins with microscopic algae and ends with macroscopic beauty.
Spectroscopy gives us the ability to move beyond observation and into measurement. It turns color into data, and data into understanding.
Whether in a laboratory, a classroom, or standing in front of flamingos at Sunken Gardens, the same principle applies: every shade of pink has a spectral fingerprint behind it, waiting to be measured.