Raman spectroscopy is an experiment that collects Raman scattering as the signal. When the light passes through the sample, some is scattered as Raman scattering. These photons are in the visible range, but they’ve lost some energy, meaning the wavelength will be different. The difference in wavelength is called the Raman shift and it is the same as the difference between vibrational energy levels. This is calculated by the following equation:
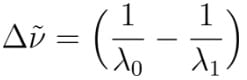
where Δν~ is the shift in wavenumbers, λ0, is the laser wavelength, and λ1 is the scattered wavelength. For example, carbon double bonds have a vibration at 1600 cm-1. If a 514nm laser beam is directed through a sample, the scattered signal will have a wavelength of ~560nm. This is depicted in the following image:
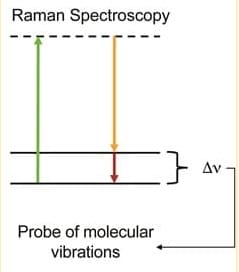
The green photon excites to a virtual state (an energy level that is too short-lived to measure) from the ground vibrational state. Then, the molecule relaxes into the excited vibrational state, emitting a yellow photon. It has lost energy equal to the difference in the vibrational levels. Collecting over multiple wavelengths allows you to generate a vibrational spectrum for your sample. This is unique for each molecule, so it can be used for sample identification. Don’t worry, though. The SpectraWiz software is able to do the Raman shift calculation automatically. The software also has an application called Spectral ID that allows you to compare unknown samples to a database of known molecular spectra.
Experimental considerations: Raman scattering is emitted in all directions, so signal is often collected at 90° from the incident beam to avoid collecting any transmitted light. Also, if the incident beam excites to a real (electronic) state instead of a virtual state, a stronger signal from fluorescence will wash out the weaker Raman signal.