
Marino DiFranco, Joana Capote, Marbella Quiñonez, and Julio L. Vergara
Two hybrid voltage-sensing systems based on fluorescence resonance energy transfer (FRET) were used to record membrane potential changes in the transverse tubular system (TTS) and surface membranes of adult mice skeletal muscle fibers. Farnesylated EGFP or ECFP (EGFP-F and ECFP-F) were used as immobile FRET donors, and either non-fluorescent (dipicrylamine [DPA]) or fluorescent (oxonol dye DiBAC4(5)) lipophilic anions were used as mobile energy acceptors. Flexor digitorum brevis (FDB) muscles were transfected by in vivo electroporation with pEGFP-F and pECFP-F. Farnesylated fluorescent proteins were efficiently expressed in the TTS and surface membranes. Voltage-dependent optical signals resulting from resonance energy transfer from fluorescent proteins to DPA were named QRET transients, to distinguish them from FRET transients recorded using DiBAC4(5). The peak ΔF/F of QRET transients elicited by action potential stimulation is twice larger in fibers expressing ECFP-F as those with EGFP-F (7.1% vs. 3.6%). These data provide a unique experimental demonstration of the importance of the spectral overlap in FRET. The voltage sensitivity of QRET and FRET signals was demonstrated to correspond to the voltage-dependent translocation of the charged acceptors, which manifest as nonlinear components in current records. For DPA, both electrical and QRET data were predicted by radial cable model simulations in which the maximal time constant of charge translocation was 0.6 ms. FRET signals recorded in response to action potentials in fibers stained with DiBAC4(5) exhibit ΔF/F amplitudes as large as 28%, but their rising phase was slower than those of QRET signals. Model simulations require a time constant for charge translocation of 1.6 ms in order to predict current and FRET data. Our results provide the basis for the potential use of lipophilic ions as tools to test for fast voltage-dependent conformational changes of membrane proteins in the TTS. The fluorescence spectra of EGFP-F and ECFP-F were measured in vivo from isolated fibers mounted in the fluorescence microscope described above but additionally equipped with a fiber optic–coupled spectrofluorimeter (EPP2000, StellarNet).
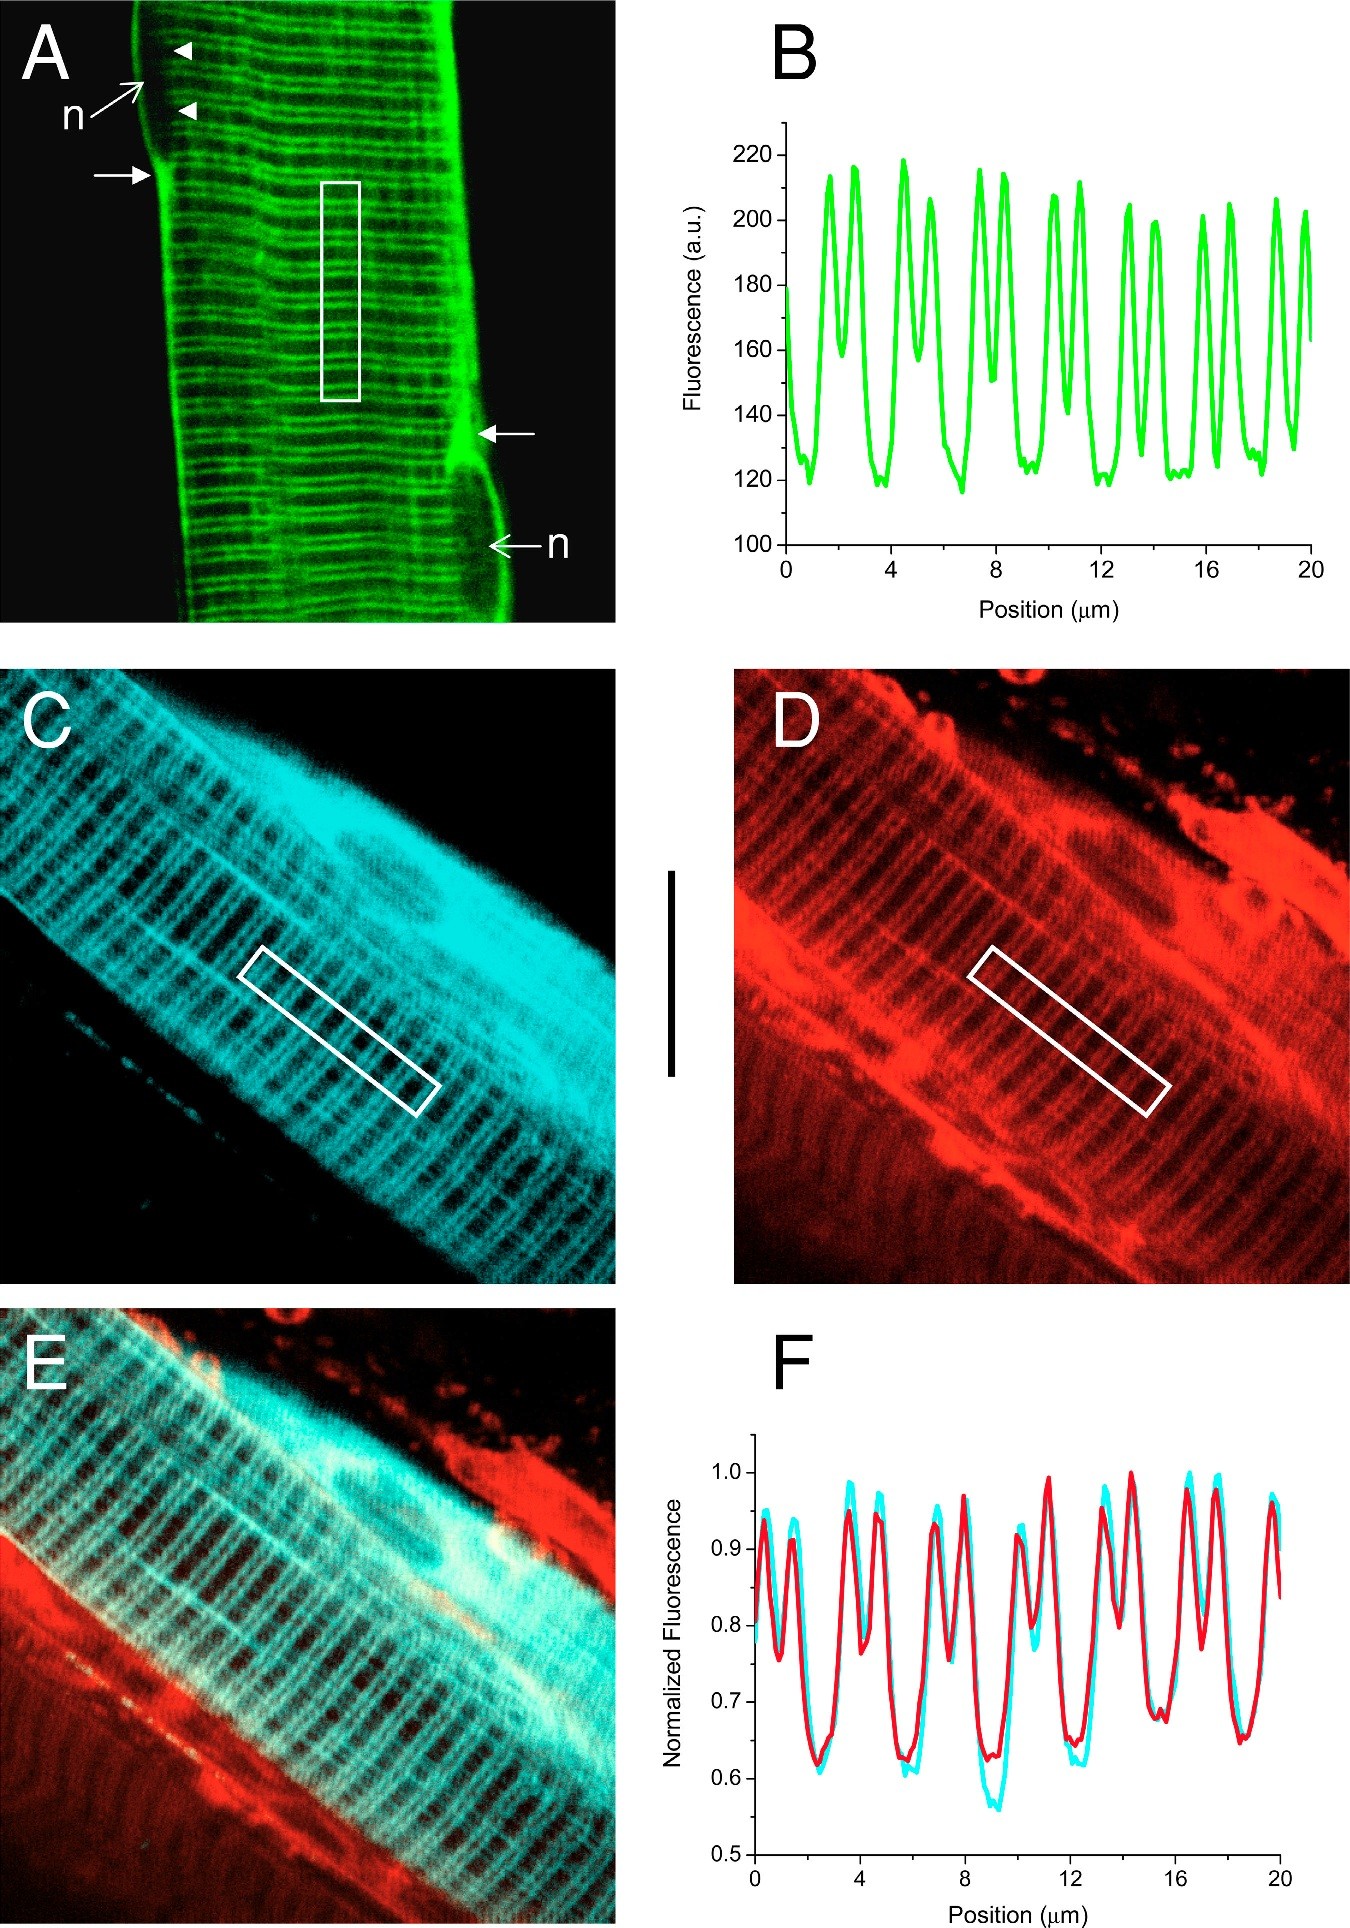
Membrane expression of EGFPF and ECFP-F in FDB muscle fi bers. (A) TPLSM image section obtained at the medial plane of a muscle fi ber expressing EGFP-F. n denotes nucleus; arrowheads point to the cytoplasmic side of a nucleus; arrows point toward areas of increased fl uorescence close to the poles of nuclei. (B) Fluorescence intensity profi le obtained from the area delimited by the white rectangle in A. (C and D) TPLSM image sections of an FDB muscle transfected with pECFP-F and stained extracellularly with di-8-ANEPPS. ECFP-F and di-8-ANEPPS fl uorescence images are shown in C and D, respectively. (E) Superimposition of image sections in C and D. (F) Normalized fluorescence intensity profi les measured from the area delimited by the rectangles in Fig. 2, C (cyan trace) and D (red trace). The vertical calibration bar is 20μm and applies to all the images.