The system sensitivity curve shows the total efficiency of the spectrometers. The total efficiency is a combination of the grating, detector, and optics. Below is a system sensitivity curve for a VIS BLUE-Wave spectrometer model:
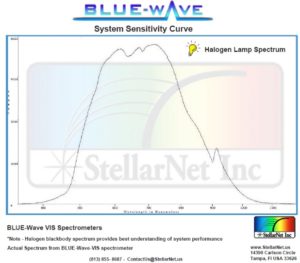
It was generated using a halogen lamp, which is a broadband visible and IR source. The spectrum shows counts versus wavelength, which means it is a measure of absolute signal collected, not a percentage. Some of the shape also comes from the light source, but it is still an informative spectrum. It has high counts for 500-800 nm, but it also has some counts towards 400 and 1000 nm. For spectrometers rated for the UV, deuterium lamps are also used for the UV wavelengths.