 Raman Spectroscopy has been a pillar of the Physical Chemistry community since its discovery in 1928 by its namesake C. V. Raman. The simplicity and robustness of the technique makes it ideal for a wide variety of applications ranging from the biological sciences, where it can be used to analyze protein conformations and water binding properties,1 to solid state physics, where it can be used to measure temperature of a substance2 as well as providing information about particular phonon modes.3 If one is clever, Raman spectroscopy is even sensitive enough to investigate single molecules.4
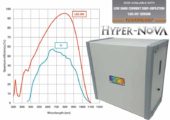
When choosing a Raman instrument, the first consideration must be the wavelength of the laser that will be used to excite the sample. Because the Raman shift is directly dependent on the vibrational structure of the sample (Figure 1), it is independent of the excitation wavelength, i.e. the chemical fingerprint remains the same. That being said, the choice of that excitation wavelength can be cleverly chosen to optimize experimental efficiency. The three major considerations for choosing the correct excitation wavelength for Raman spectroscopy are scattering efficiency, fluorescence, and sample heating. StellarNet offers a variety of laser wavelengths to suit your spectroscopy needs (Raman Lasers, Table 1).
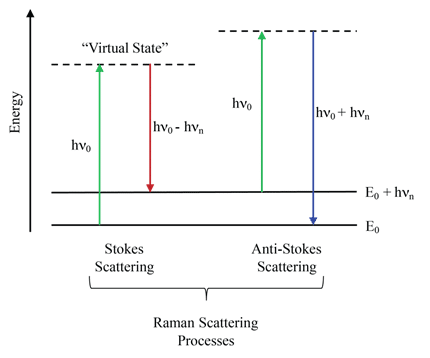
Figure 1: Energy level schematic of the two Raman scattering processes. The Stokes Raman process generates photons with frequencies lower than that of the excitation source and therefore are detected at a higher wavelength, whereas the Anti-Stokes Raman process generates photons with frequencies higher than that of the excitation source and therefore are detected at a lower wavelength. In both cases, the Raman shift is dependent on the vibrational structure of the sample (hnn).
Raman Efficiency: Raman scattering efficiency is proportional to l-4, where l is the wavelength of the laser light. This means that for an identical sample, the scattering efficiency for a sample excited by a 532 nm laser beam will be ~5 times more efficient than if a 785 nm laser was used, and 16 times more efficient than if a 1064 nm laser was used. This is important when considering the timescales of your experiment – in order to achieve the same signal to noise, we necessarily require a scan time 16 times longer when using a 1064 nm laser compared to a 532 nm laser. While this seems to imply that shorter wavelengths are always better, we must account for another phenomenon: chemical fluorescence.
Fluorescence effects: Fluorescence photons are generated in a very similar process to Raman scattering, but via a slightly different mechanism (Figure 2). Because the energetic shift relative to the excitation source is what is measured, the Raman scattering process produces the same spectrum regardless of excitation wavelength. Fluorescence, on the other hand, occurs at a fixed wavelength and so it will shift with different excitation wavelengths. Importantly, fluorescence processes tend to be very broad and strong, meaning that the fluorescence from your sample can swamp out the signature Raman features. Typically speaking, darker samples will have strong fluorescence signals so a cleverly chosen laser source must be utilized in order to minimize those fluorescence contributions to the spectrum. A longer wavelength excitation source, such as a 1064 nm laser typically results in a very low fluorescence signal. As laser wavelength shifts to the infrared region of the spectrum, laser absorption and subsequent sample heating become a concern.
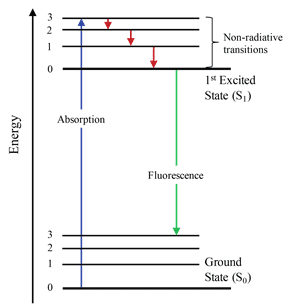
Figure 2: Energy level schematic of the fluorescence process. Because fluorescence involves excitation to a real state, S1 (as opposed to the virtual states exploited in Raman spectroscopy), fluorescence spectra are highly dependent on the excitation laser wavelength. In order to minimized background fluorescence when performing Raman measurements, longer wavelength laser sources can be used as they are unable to provide sufficient energy to excite to the S1 state.
Sample heating: Sample heating is caused by laser absorption, which occurs more readily with longer wavelength laser light. This heating can lead to alterations in experimental conditions (i.e. the vibrational spectrum of a sample at different temperatures can be drastically different) and even sample damage (liquid samples may boil and darkly colored samples can burn or even ignite). This can be mitigated by lowering the laser power, but of course this will increase the acquisition time needed to achieve acceptable signal to noise. One could also implement a rotation or rastering of the sample, but this adds a degree of complexity as well as necessitating high sample quality.
| 532nm | 785nm | 1064nm | |
| Raman Efficiency | High | Medium | Low |
| Fluorescence | High | Medium | Low |
| Heat Absorption | Low | Medium | High |
Table 1: Summary of the pros and cons of the three most common laser wavelengths used in Raman Spectroscopy. The 785 nm laser source is the most commonly used of these three as it provides a happy medium for the “big three” considerations, thus providing a robust and versatile Raman system.
More info about StellarNet Raman Spectrometer Systems
(1) Barth, A.; Zscherp, C. What vibrations tell us about proteins. Q. Rev. Biophys. 2002, 35 (4), 369–430 DOI: 10.1017/S0033583502003815.
(2) Smith, J. D.; Cappa, C. D.; Drisdell, W. S.; Cohen, R. C.; Saykally, R. J. Raman thermometry measurements of free evaporation from liquid water droplets. J. Am. Chem. Soc. 2006, 128 (39), 12892–12898 DOI: 10.1021/ja063579v.
(3) Ferrari, A. C. Raman spectroscopy of graphene and graphite: Disorder, electron–phonon coupling, doping and nonadiabatic effects. Solid State Commun. 2007, 143 (1–2), 47–57 DOI: 10.1016/j.ssc.2007.03.052.
(4) Kneipp, K.; Wang, Y.; Kneipp, H.; Perelman, L. T.; Itzkan, I.; Dasari, R. R.; Feld, M. S. Single Molecule Detection Using Surface-Enhanced Raman Scattering (SERS). Phys. Rev. Lett. 1997, 78 (9), 1667–1670.

By Tony Rizzuto, PhD – Physical Chemistry
StellarNet Technical Staff Writer
UC Berkeley Chemistry