The SpectraWizard’s Spectroscopy Application Challenge has officially ended! Spectroscopists from all over the world competed against each other for a chance to win $5,000 in StellarCash. Check out the winning spectroscopy application below and don’t forget to check out our Back to School Spectrometer Special available now through the end of September! Thank you to all the contestants, there were lots of amazing submissions and it was very hard to choose winners. We are all very excited to share this spectroscopy application with you! Follow us on social media to see all the updates.
1st Place: Hamed Abbasi
Integrating NIR Intraoperative Fluorescence Imaging with Raman Spectroscopy for Guiding Oral Cancer Surgery: Uniting the Superheroes!
Hold onto your lab coats, folks, because each year a whopping 350,000 people around the globe are diagnosed with oral cavity cancer. But fret not—surgeons are on a quest to evict those nasty tumors, and they’re even packing an additional buffer zone of healthy tissue, just to be extra sure. Yes, the goal of the surgery is to completely remove the tumor, along with a margin—of 5 mm or more—of surrounding healthy tissue. Getting that perfect 5mm margin is like landing a triple axel in figure skating. Miss it, and you’re most likely looking at rounds of post-op (radio)therapy. Even with the extra post-op treatments, those who miss the mark have a survival rate of 68%, while those who nail it soar to 84%.

But hey, it’s not just about cutting out the bad stuff; you also wanna keep the good stuff—like your smile and your ability to talk, munch, and gulp. Surgeons use all kinds of gizmos like pre-op images, but once the scalpel’s in hand, they’re kinda like culinary chefs, using their senses to get the recipe just right. Yet, believe it or not, the perfect margin is achieved in only 15% to 26% of surgeries. Yikes!


Enter the superheroes of surgery: Fluorescence Imaging (FLI) and Raman Spectroscopy (RS)! FLI is a spectral imaging technique used to highlight the tumor after injection of a tumor-specific fluorescence tracer. It’s like the GPS for tumor-finding, shining a near-infrared spotlight that even reveals the hide-and-seek champion tumor tissues deep inside. The hitch? Sometimes the spotlight shines unnecessarily too bright, or not bright enough. Meanwhile, RS is a molecular spectroscopic technique and is the Sherlock Holmes of tissue analysis. It’s uniquely precise but kinda slow, like a quiet-but-brilliant detective whispering clues. It works well in a specific area but doesn’t have the gusto to scan the whole crime scene quickly. The dream team? Use FLI for the sweeping overview and bring in RS to double-check the nitty-gritty details. It’s like using a metal detector to find treasure and then digging with a spade to make sure it’s gold!

Tumour is delineated by the red dotted line; tissue is delineated by blue dotted line (a, b, and c). a Haematoxylin and eosin–stained slide. b Fluorescent image showing colocalisation of signal with tumour. c Cluster analysis of the Raman image illustrating that the tumour area cannot be characterised by RS because the fuorescence signal is too strong.
“But wait,” you say, “these techniques are like oil and water!” True, they used to keep to their corners of the lab, especially since their signals can overlap and create a scientific traffic jam. However, in a twist worthy of a sci-fi thriller, we’ve found a way to make them BFFs! We tuned RS excitation to a sweet wavelength (900–915 nm, if you’re taking notes) that doesn’t mess with FLI’s vibe. And voilà! We developed a unique NIR RS device with a tiny fiber probe (100-micron core) for delivering light to and from the tissue. And yes, we are pioneering a tech mash-up that’s got clinical studies rockin’ at Erasmus Medical Center in Rotterdam. So grab your popcorn, because this surgical saga is getting a sequel that’s packed with more action, more precision, and way more hope for patients!

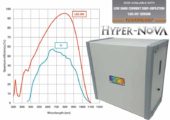
Overlap of Raman spectra excited with typical laser wavelengths used in clinical trials, i.e., 514 nm, 532 nm, 671 nm, 785 nm, 830 nm, 909 nm, 976 nm, and 1064 nm with absorption spectra of SGM-101, ICG, and water. A laser wavelength below ∼900 nm overlaps with the absorption band of exogenous fluorescent agents (left red shaded zones) and consequently hinders Raman signal by photon shot noise originating from exogenous fluorescent agents. Excitation above ∼915 nm shifts the HWN part of the Raman spectra toward higher water absorption (right red shaded zone), resulting in intense tissue self-absorption.
Runner Up: John Swierk
The Photochemistry of Tattoos
Why does light cause a tattoo to fade? This simple question has huge implications as laser tattoo removal is a 4+ billion dollar a year industry. Surprisingly, despite the growing number of tattoos and laser removal we don’t actually understand how laser tattoo removal actually works. Our lab uses spectroscopy in lots of different ways to answer this question. One cool spectroscopy that we use is nanosecond shadowgraphy. Just like you can make shadow puppets with your fingers in front of a light, we use a nanosecond laser to illuminate a sample from behind. We can then zap the sample with another nanosecond laser and watch as an explosion and shockwave develops. From that we can figure out how hot and how much pressure the laser creates when it hits the tattoo. In order to perform nanosecond shadowgraphy, however, we need to be able to get light through the sample so we can’t use actual skin. Instead, we have developed transparent mimics of skin using polydimethylsiloxane (PDMS), a type of plastic, that mimic the mechanical properties of the different layers in skin.
We also use spectroscopy to understand what happens to tattooed skin that has been exposed to laser light. Working with a collaborator at Binghamton, we can tattoo skin from a cadaver and zap it with a laser. We can then slice the skin into thin slices and use X-ray fluorescence spectroscopy and Raman spectroscopy to understand what the tattoo pigments break down into and how much they move throughout the skin. We also use light to breakdown tattoo pigments in the lab and then use different spectroscopic techniques to figure out what the pigments break down into and whether those breakdown products are a risk to human health!


Left: Nanosecond shadowgraph before. Middle: 124 nanosecond after a laser pulse. Black arrow points to shockwave from the laser strike. Right: Tattooed artificial skin made from multiple layers of PDMS that mimic the mechanical properties of the different skin layers.
3rd Place: Mariam Moussilli
Laser Induced Breakdown spectroscopy for Wheat Contamination Monitoring


Did you know that without adequate contamination testing, the bag of flour in almost every household pantry could be a serious health hazard? Our innovative research makes sure that this won’t happen while keeping the environment clean. The immediate applications for our research are to:
1) Monitoring of Cadmium toxic heavy metal contamination in wheat grains related to soil pollution
and wheat variety that can pose serious health risks
2) Monitoring of poisonous fungus in wheat grains that can result in a reduction in grain yield and
cause adverse health effects in humans and animals
3) Monitoring for enzyme activity in wheat grains which leads to starch degradation, yield loss, and
end-product quality reduction
In the experimental part of our research, we used Laser Induced Breakdown Spectroscopy (LIBS) which involves the focusing of highly energetic nanosecond laser pulses onto wheat grains to generate plasma. This plasma is composed of excited molecular and atomic species that de-excite by the emission of characteristic photons. These photons act as fingerprints for the elemental composition of the wheat grains and are detected by a set of StellarNet spectrometers. The spectrometers provide us with the intensities of the photons versus the wavelengths of the photons.

Figure 1- Graphical abstract showing the LIBS technique and how we can create a fingerprint for the contaminant from the spectrometer spectra.
In the signal analysis and machine learning part of our research, We use the spectra measured using the StellarNet spectrometers to infer the concentration of the contaminants through forming calibration curves. The calibration curves compare the selected elemental emission lines to an established reference method to see how well the elemental emission lines predict the concentration of the contaminant. Also, we relate grain features (for example: color, and texture) to the level of the contaminants of interest.
Compact Spectrometer Technologies
UV-VIS
190-1150nm
Near Infrared
900-2500nm
Raman
532, 785, 1064nm
Educational
low cost / simple interface