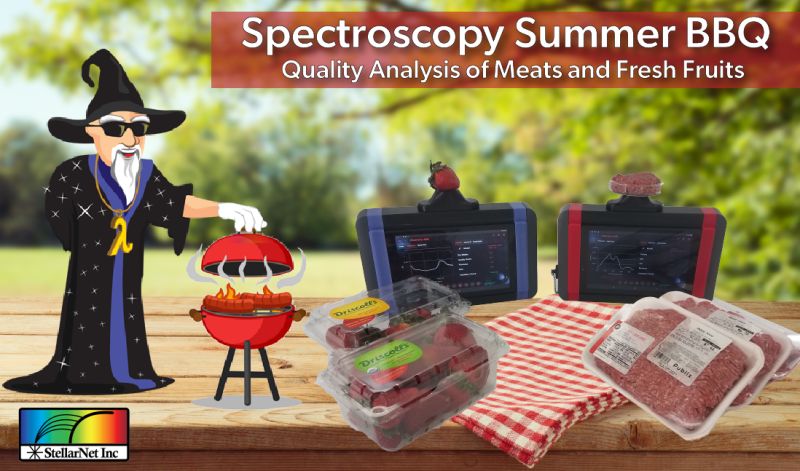
Ground Beef Classification using StellarCLASS (Nearest Neighbor Algorithm)
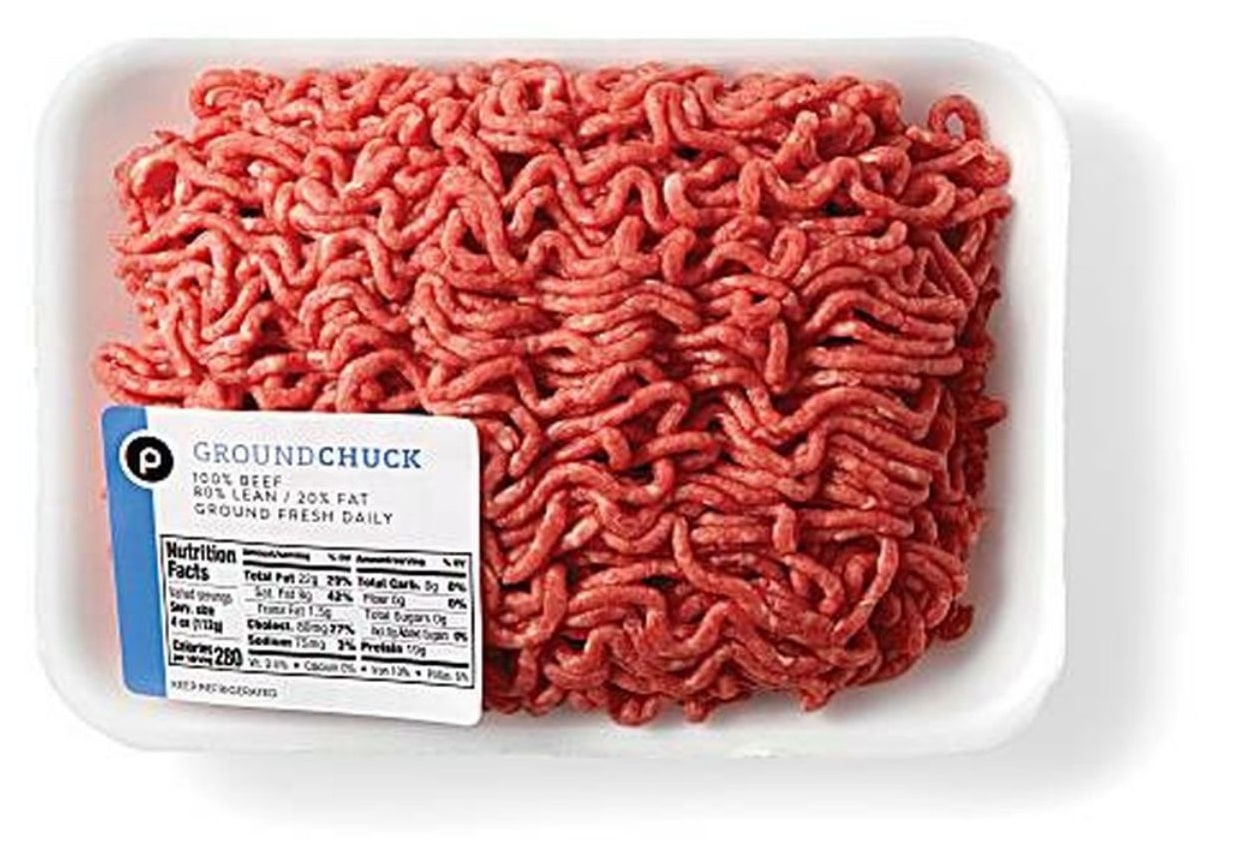
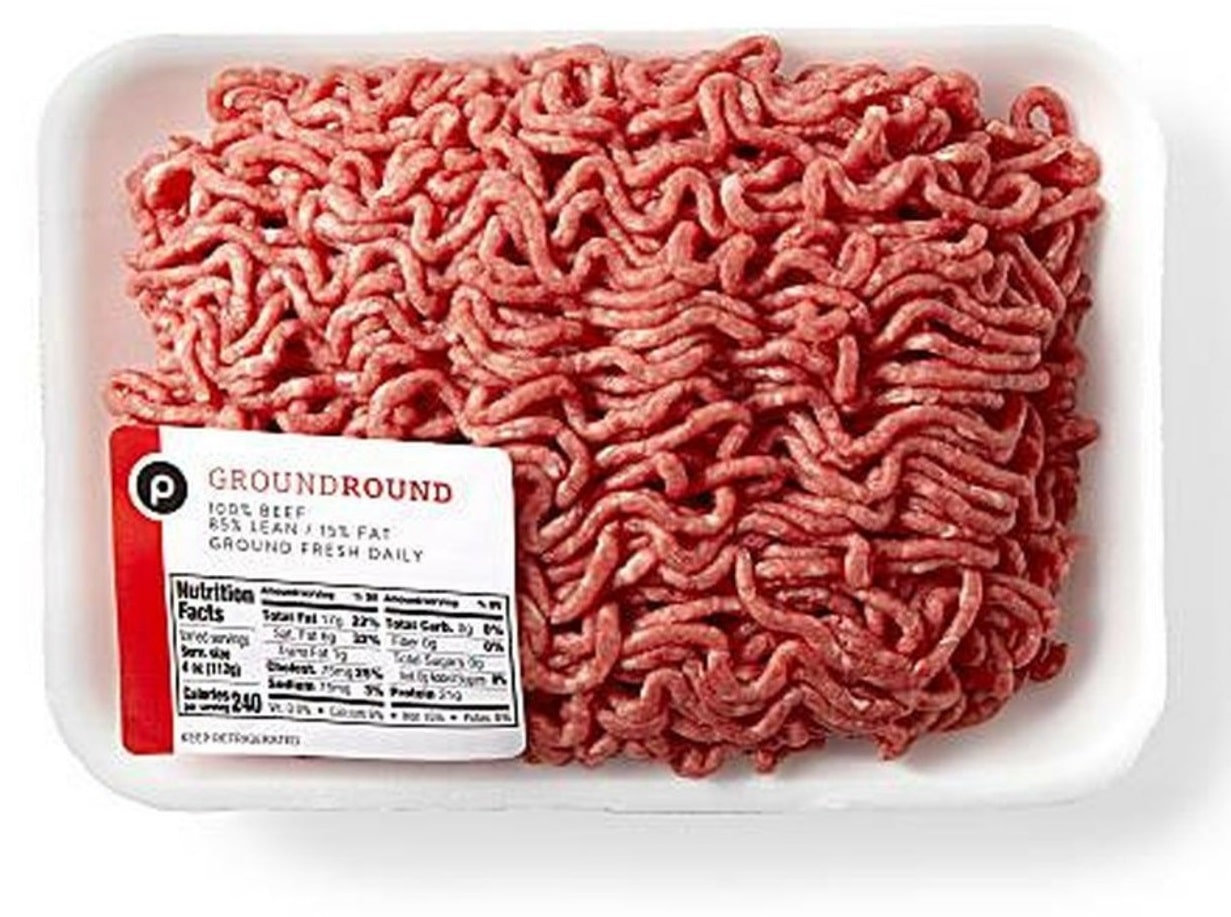
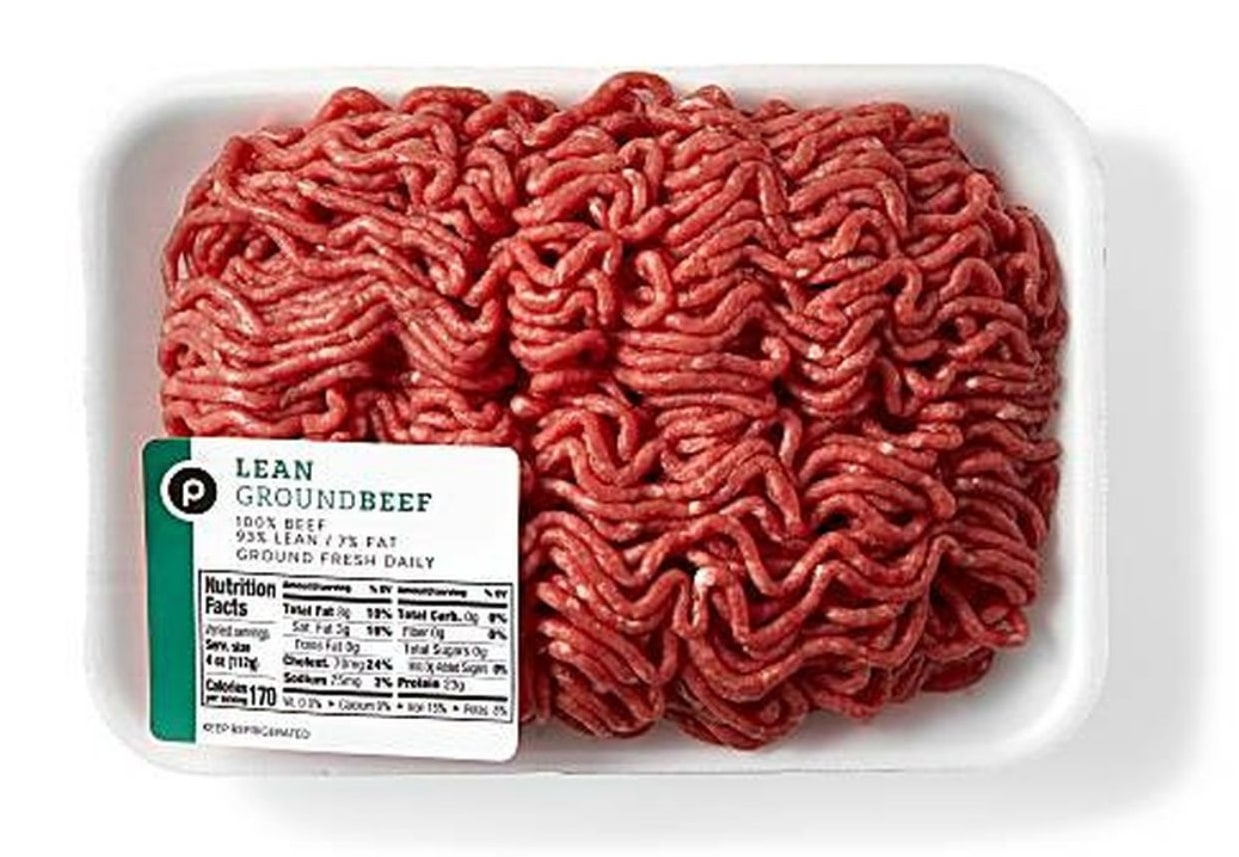
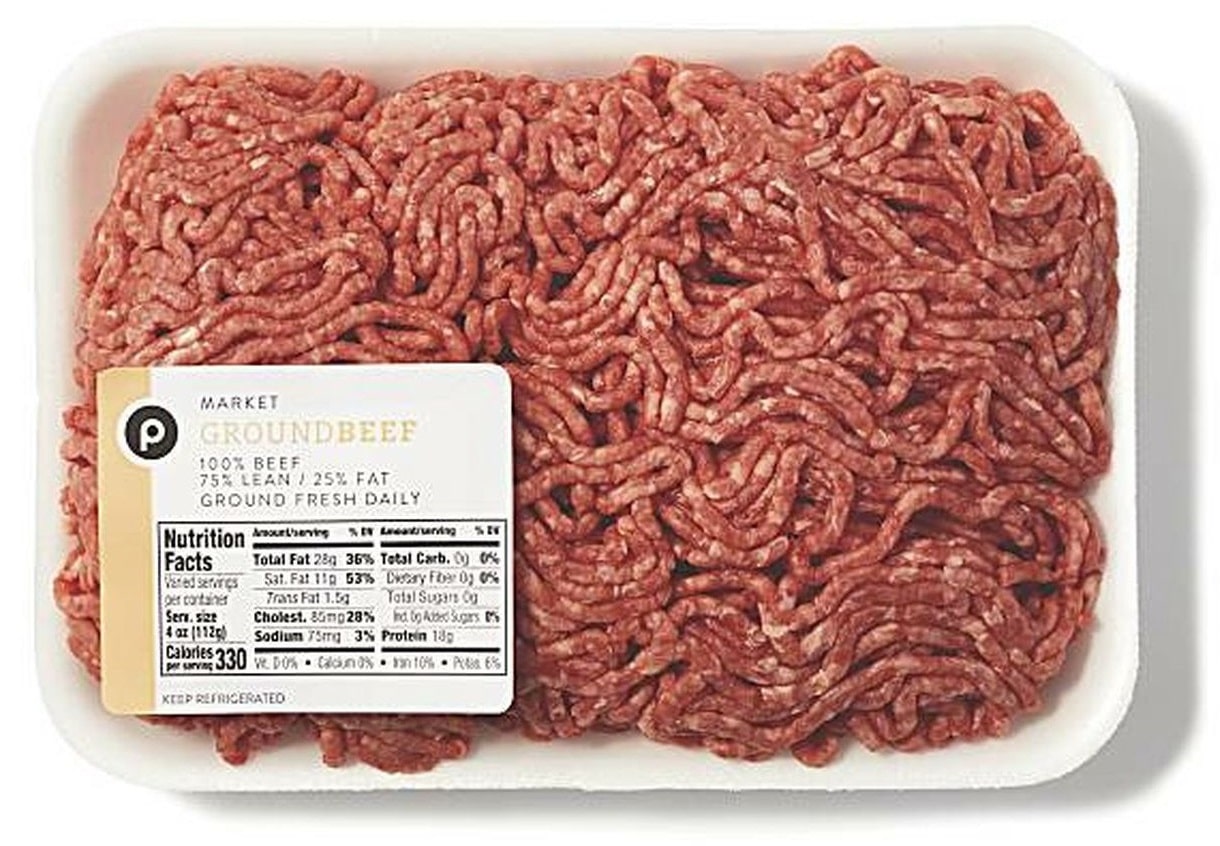
Shopping for the BBQ, the SpectraWizard visited his local grocery, Publix (Tampa, Fl), and was surprised to find many different types of ground beef! Ground Chuck, Ground Round, Lean, and Market Ground. The SpectraWizard noticed that the %Fat was the main difference between the types, but was curious about what “Market Ground” meant. The local Publix butcher told him that the Chuck was 20% Fat, the Round was 15% Fat, and the Lean was 7% Fat. All the ground beef is tested at the Publix distribution center and provided in 50lbs portions to the local stores. However, the Market Ground was made fresh daily from trimmings of other beef products. Since they could not test the Market Ground for %Fat; they had to mark it at the fattiest and cheapest type. The SpectraWizard thought this was a perfect opportunity to quickly make a classification model using the known ground beef samples and test the unknown market meat! Both StellarCLASS and StellarPLS are algorithms inside our ChemWiz-ADK PRO software provided with each instrument.
Publix Ground Beef Calibration
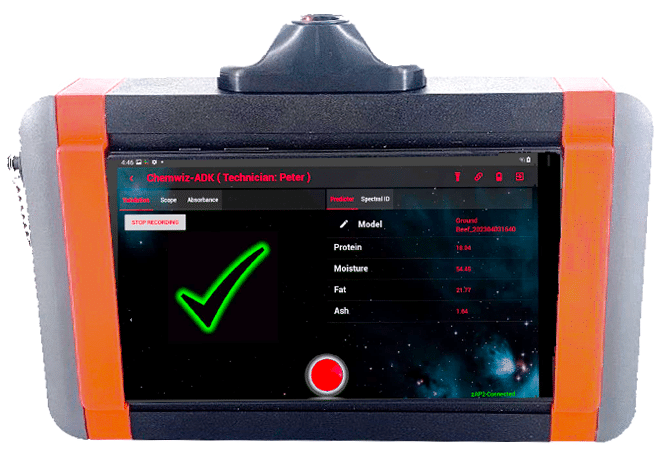
For the past month, the SpectraWizard purchased 1lb of each ground beef type and created a StellarCLASS calibration for the ChemWiz-ADK NIR analyzer. Each type of ground beef was classified according to its fat content; 20%, 15% & 7%. The SpectraWizard loves hamburgers so much that he collected over 20 different types of samples! The classification prediction accuracy was 100%. That means, that all samples, when cross-validated against his model, predicted the correct fat content every time! Now, the SpectraWizard had a tool to test the unknown Market Ground beef. Once tested, the unknown market meat consistently tested as 15% fat; however, the price is the lowest! The SpectraWizard now knows the truth behind Publix’s mystery market meat and will purchase it every time for his BBQs. If only Publix had an analyzer at the local grocery to test and label for other customers…
Quality Analysis of Fresh Fruits
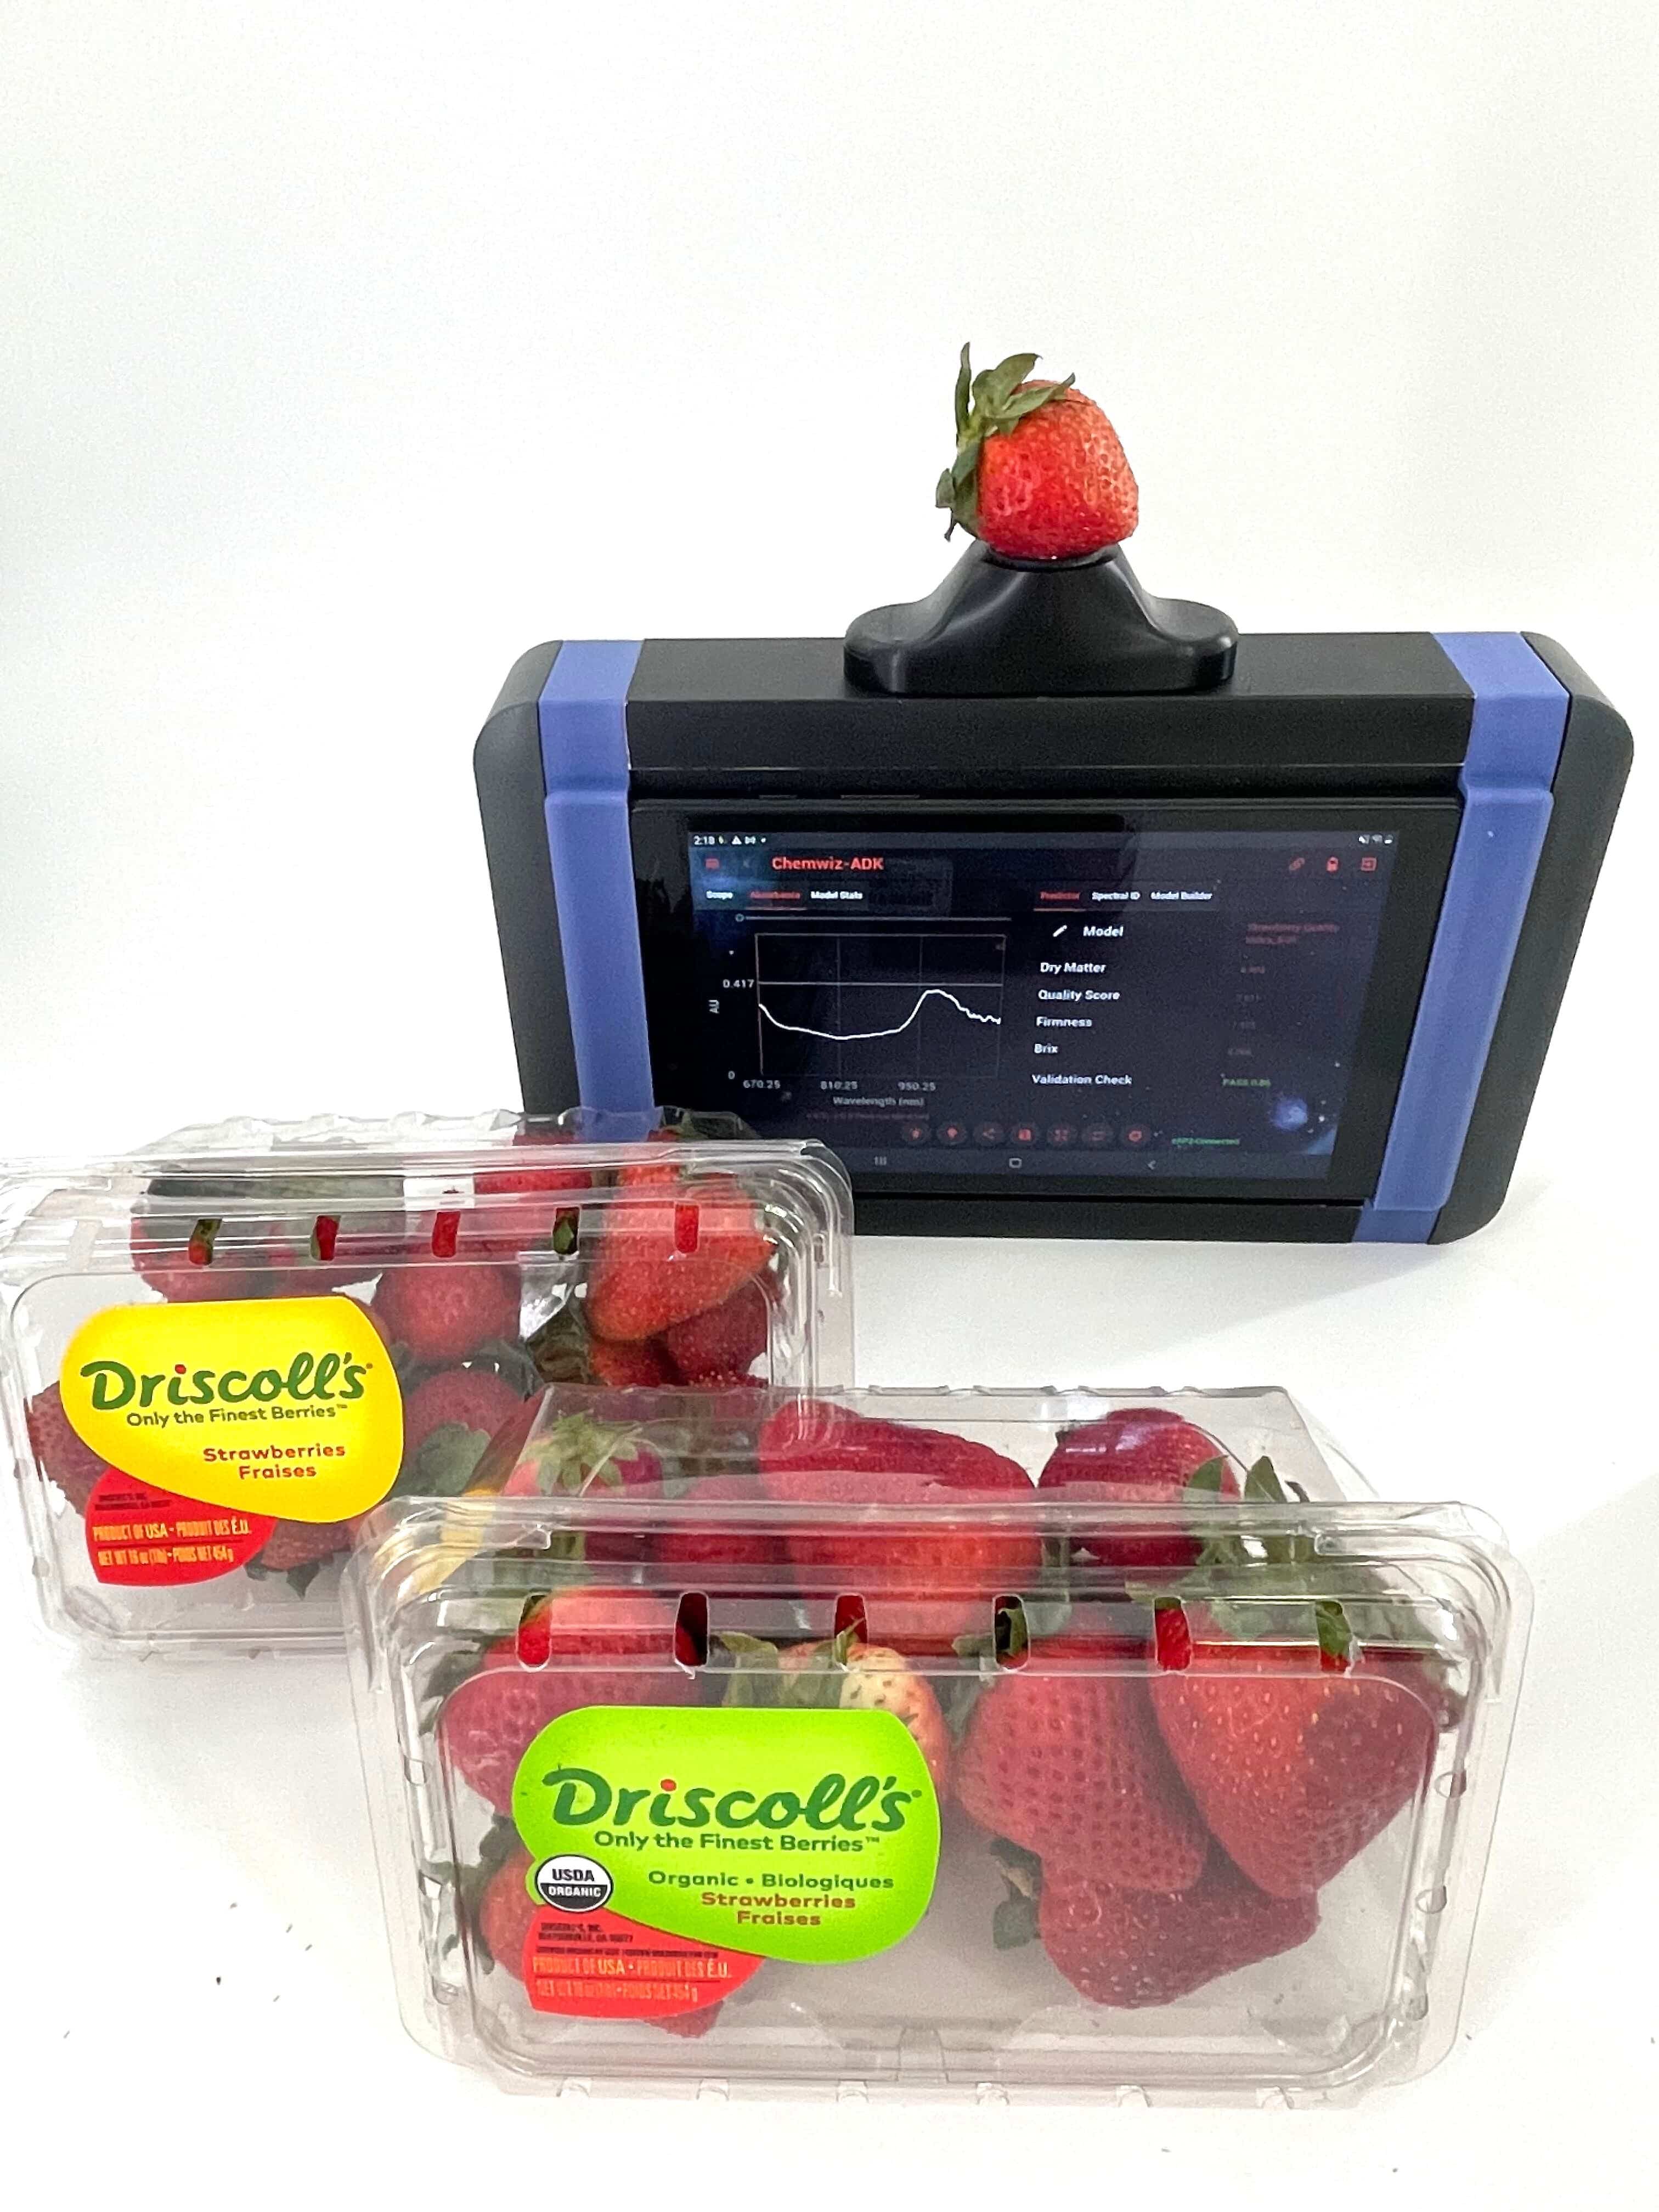
The SpectraWizard also has a sweet tooth for strawberry shortcakes and as a Florida resident, is an expert in strawberry quality. Florida strawberries are normally “in season” during early spring and the SpectraWizard noticed that the strawberries on sale today don’t seem ripe enough. He decided to use our ColorWiz handheld spectrometer along with our ChemWiz-ADK PRO software to make a calibration to predict strawberry ripeness.
Strawberry Ripeness Calibration Process
In order to calibrate the handheld ColorWiz spectrometer for strawberry ripeness measurements, the SpectraWizard must determine which measurable parameters of strawberries are indicative of ripeness. A little “googling” reveals that dry matter, BRIX, total acidity, and firmness are all great indicators that experts in strawberry selection use to grade and determine ripeness. Distributors and local groceries often use some of these analytical techniques, but currently, there are very few instruments available that can non-destructively measure all of the parameters together. Using the ColorWiz handheld spectrometer, which covers the range 350-1150nm, the SpectraWizard adds on the powerful ChemWiz-ADK PRO software. This software enables him to do chemometrics predictions using either the StellarPLS, StellarCLASS, or StellarID algorithms. In this case, he chooses the StellarPLS and calibrates the known quality parameters directly to the VIS-NIR spectrum. The easy-to-use software makes calibration a breeze. Spectral processing and outlier identification as well as model statistics are automatically provided and user mode can be advanced (admin) or basic (technician). Learn more below about the quality parameters of strawberries and how they are measured.
Dry Matter
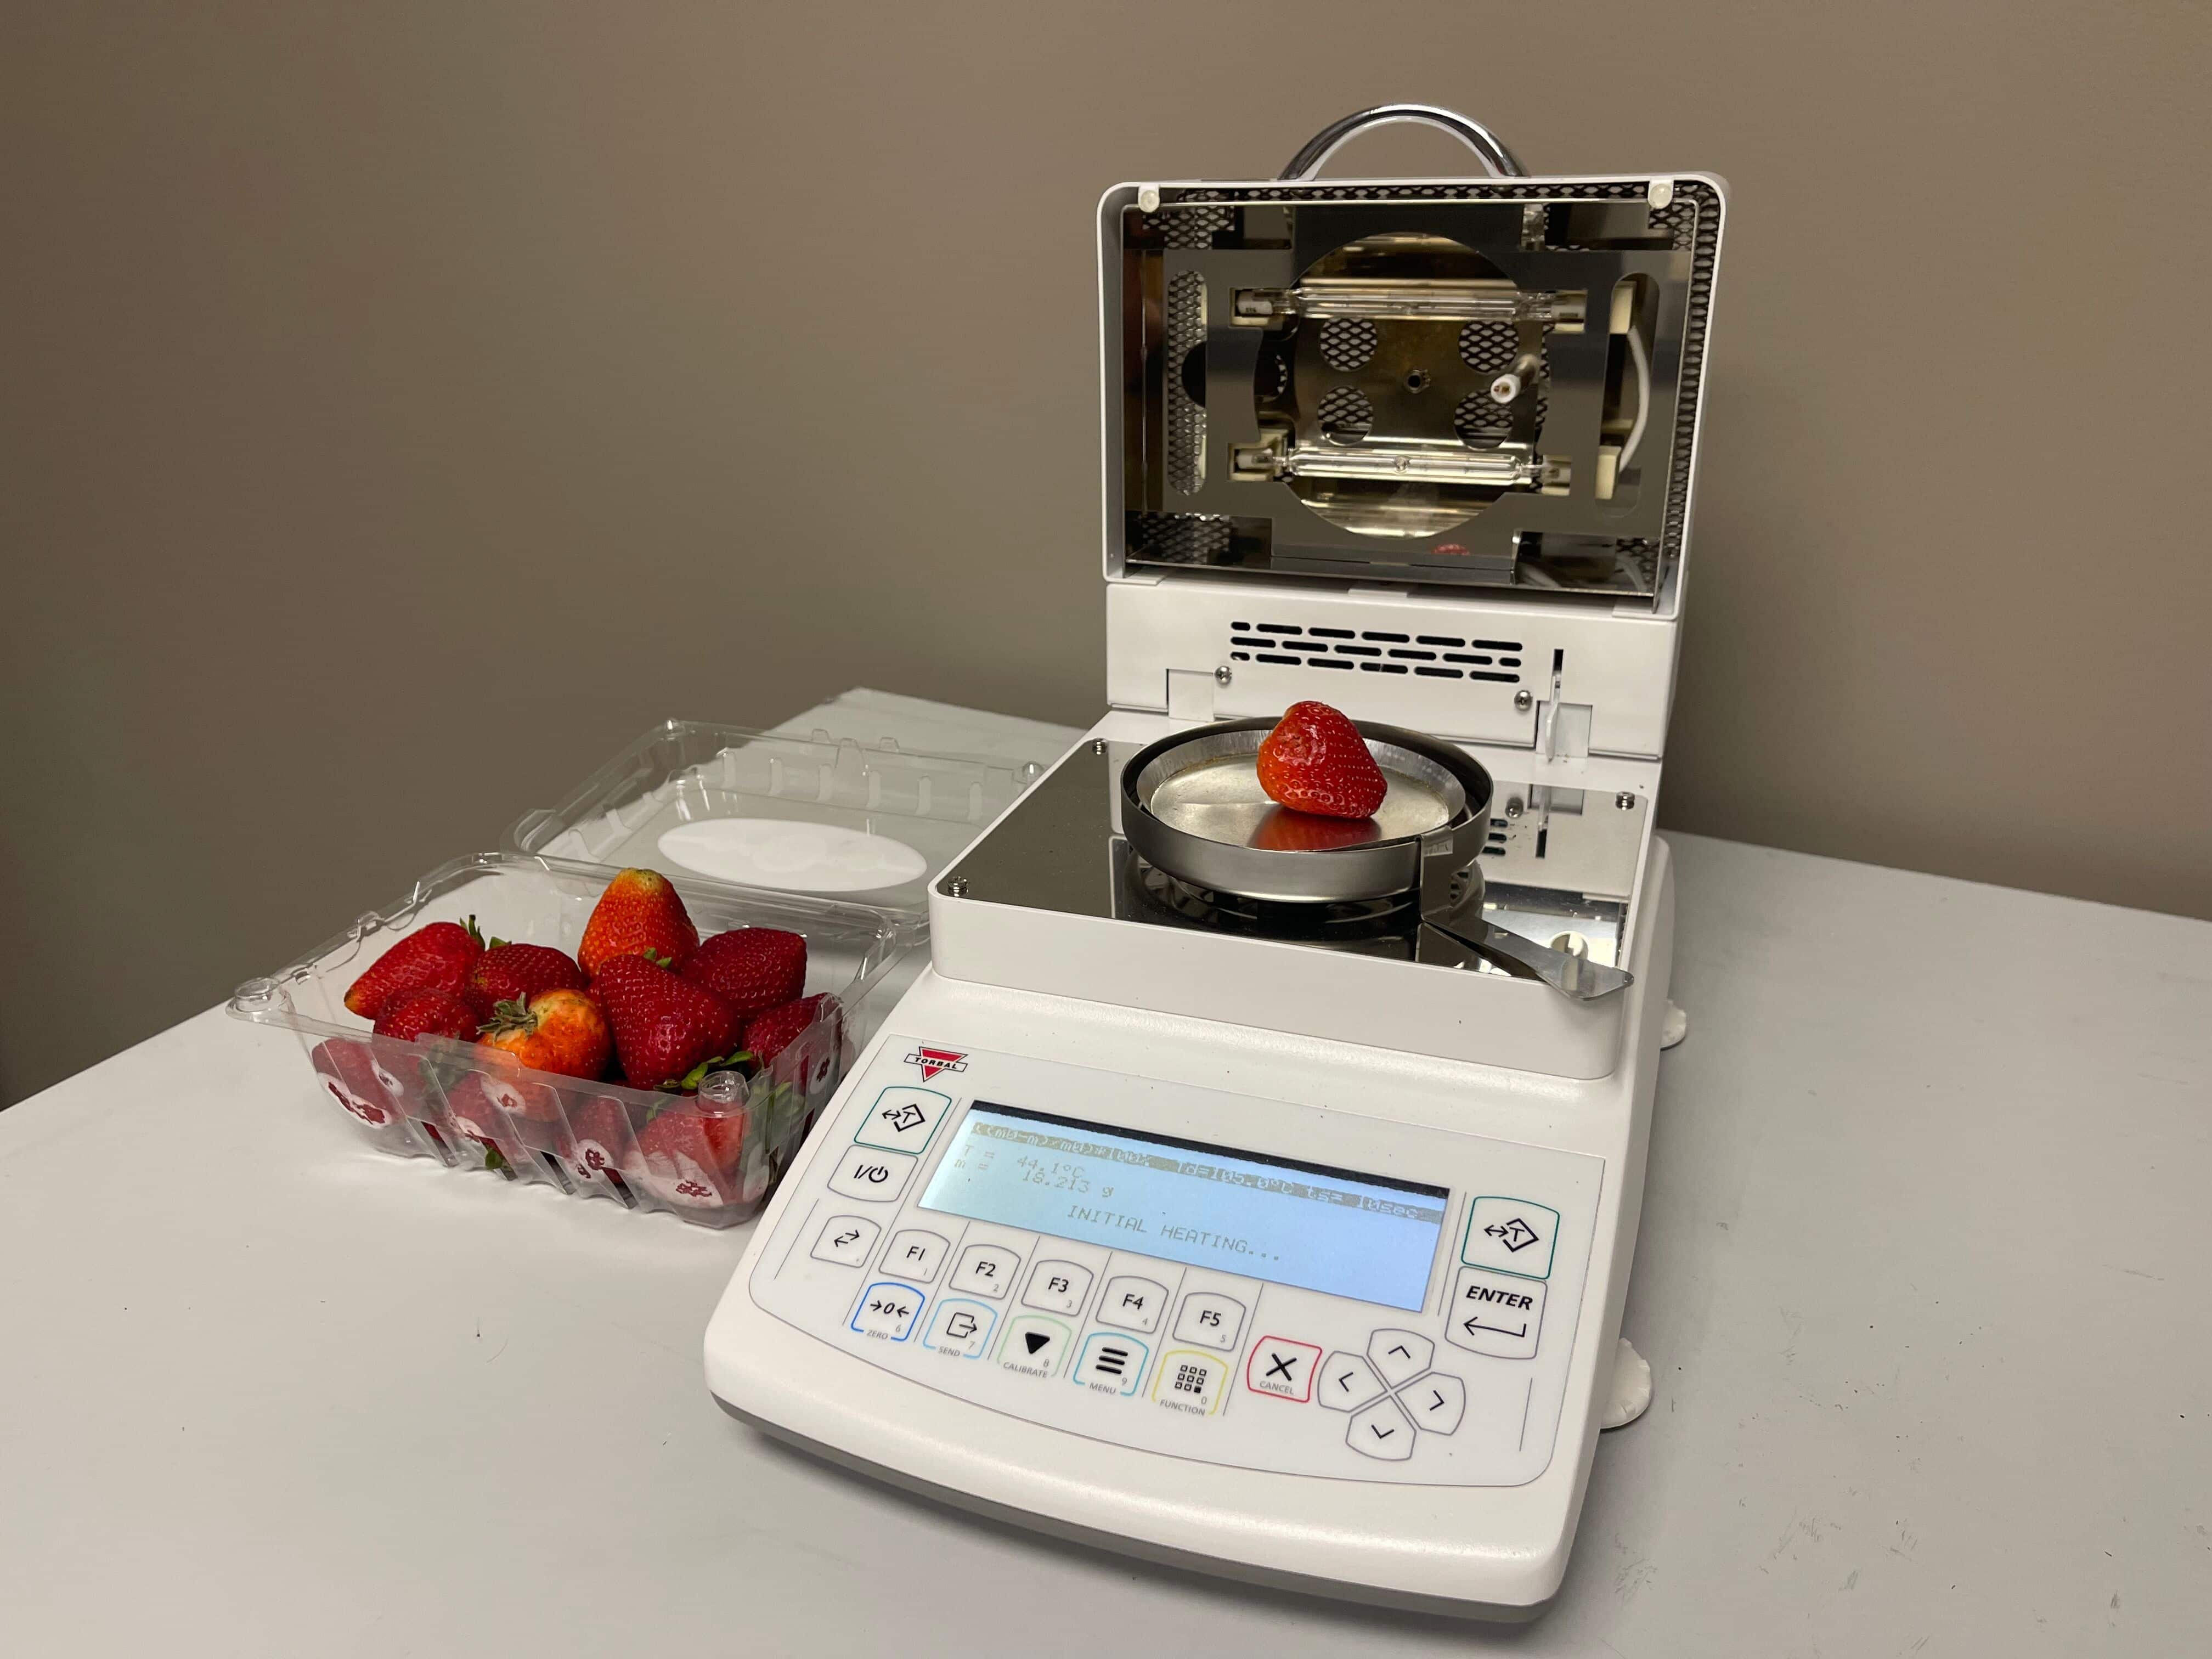
Dry matter (DM) is the solid components of a fruit, excluding the water content. It represents the sum of all the components in the fruit that remain after removing the water, such as sugars, fibers, proteins, and minerals. Dry matter content is often used as an indicator of ripeness in fruits because it correlates with various physiological and sensory changes that occur during fruit maturation. The dry matter content increases as a fruit ripens because the water content decreases while the concentration of other solid components, such as sugars and fibers, increases. The SpectraWizard uses a moisture analyzer (an oven with precision balance) to measure the water content loss of each strawberry. He records the spectrum of each fruit and records the DM content.
BRIX
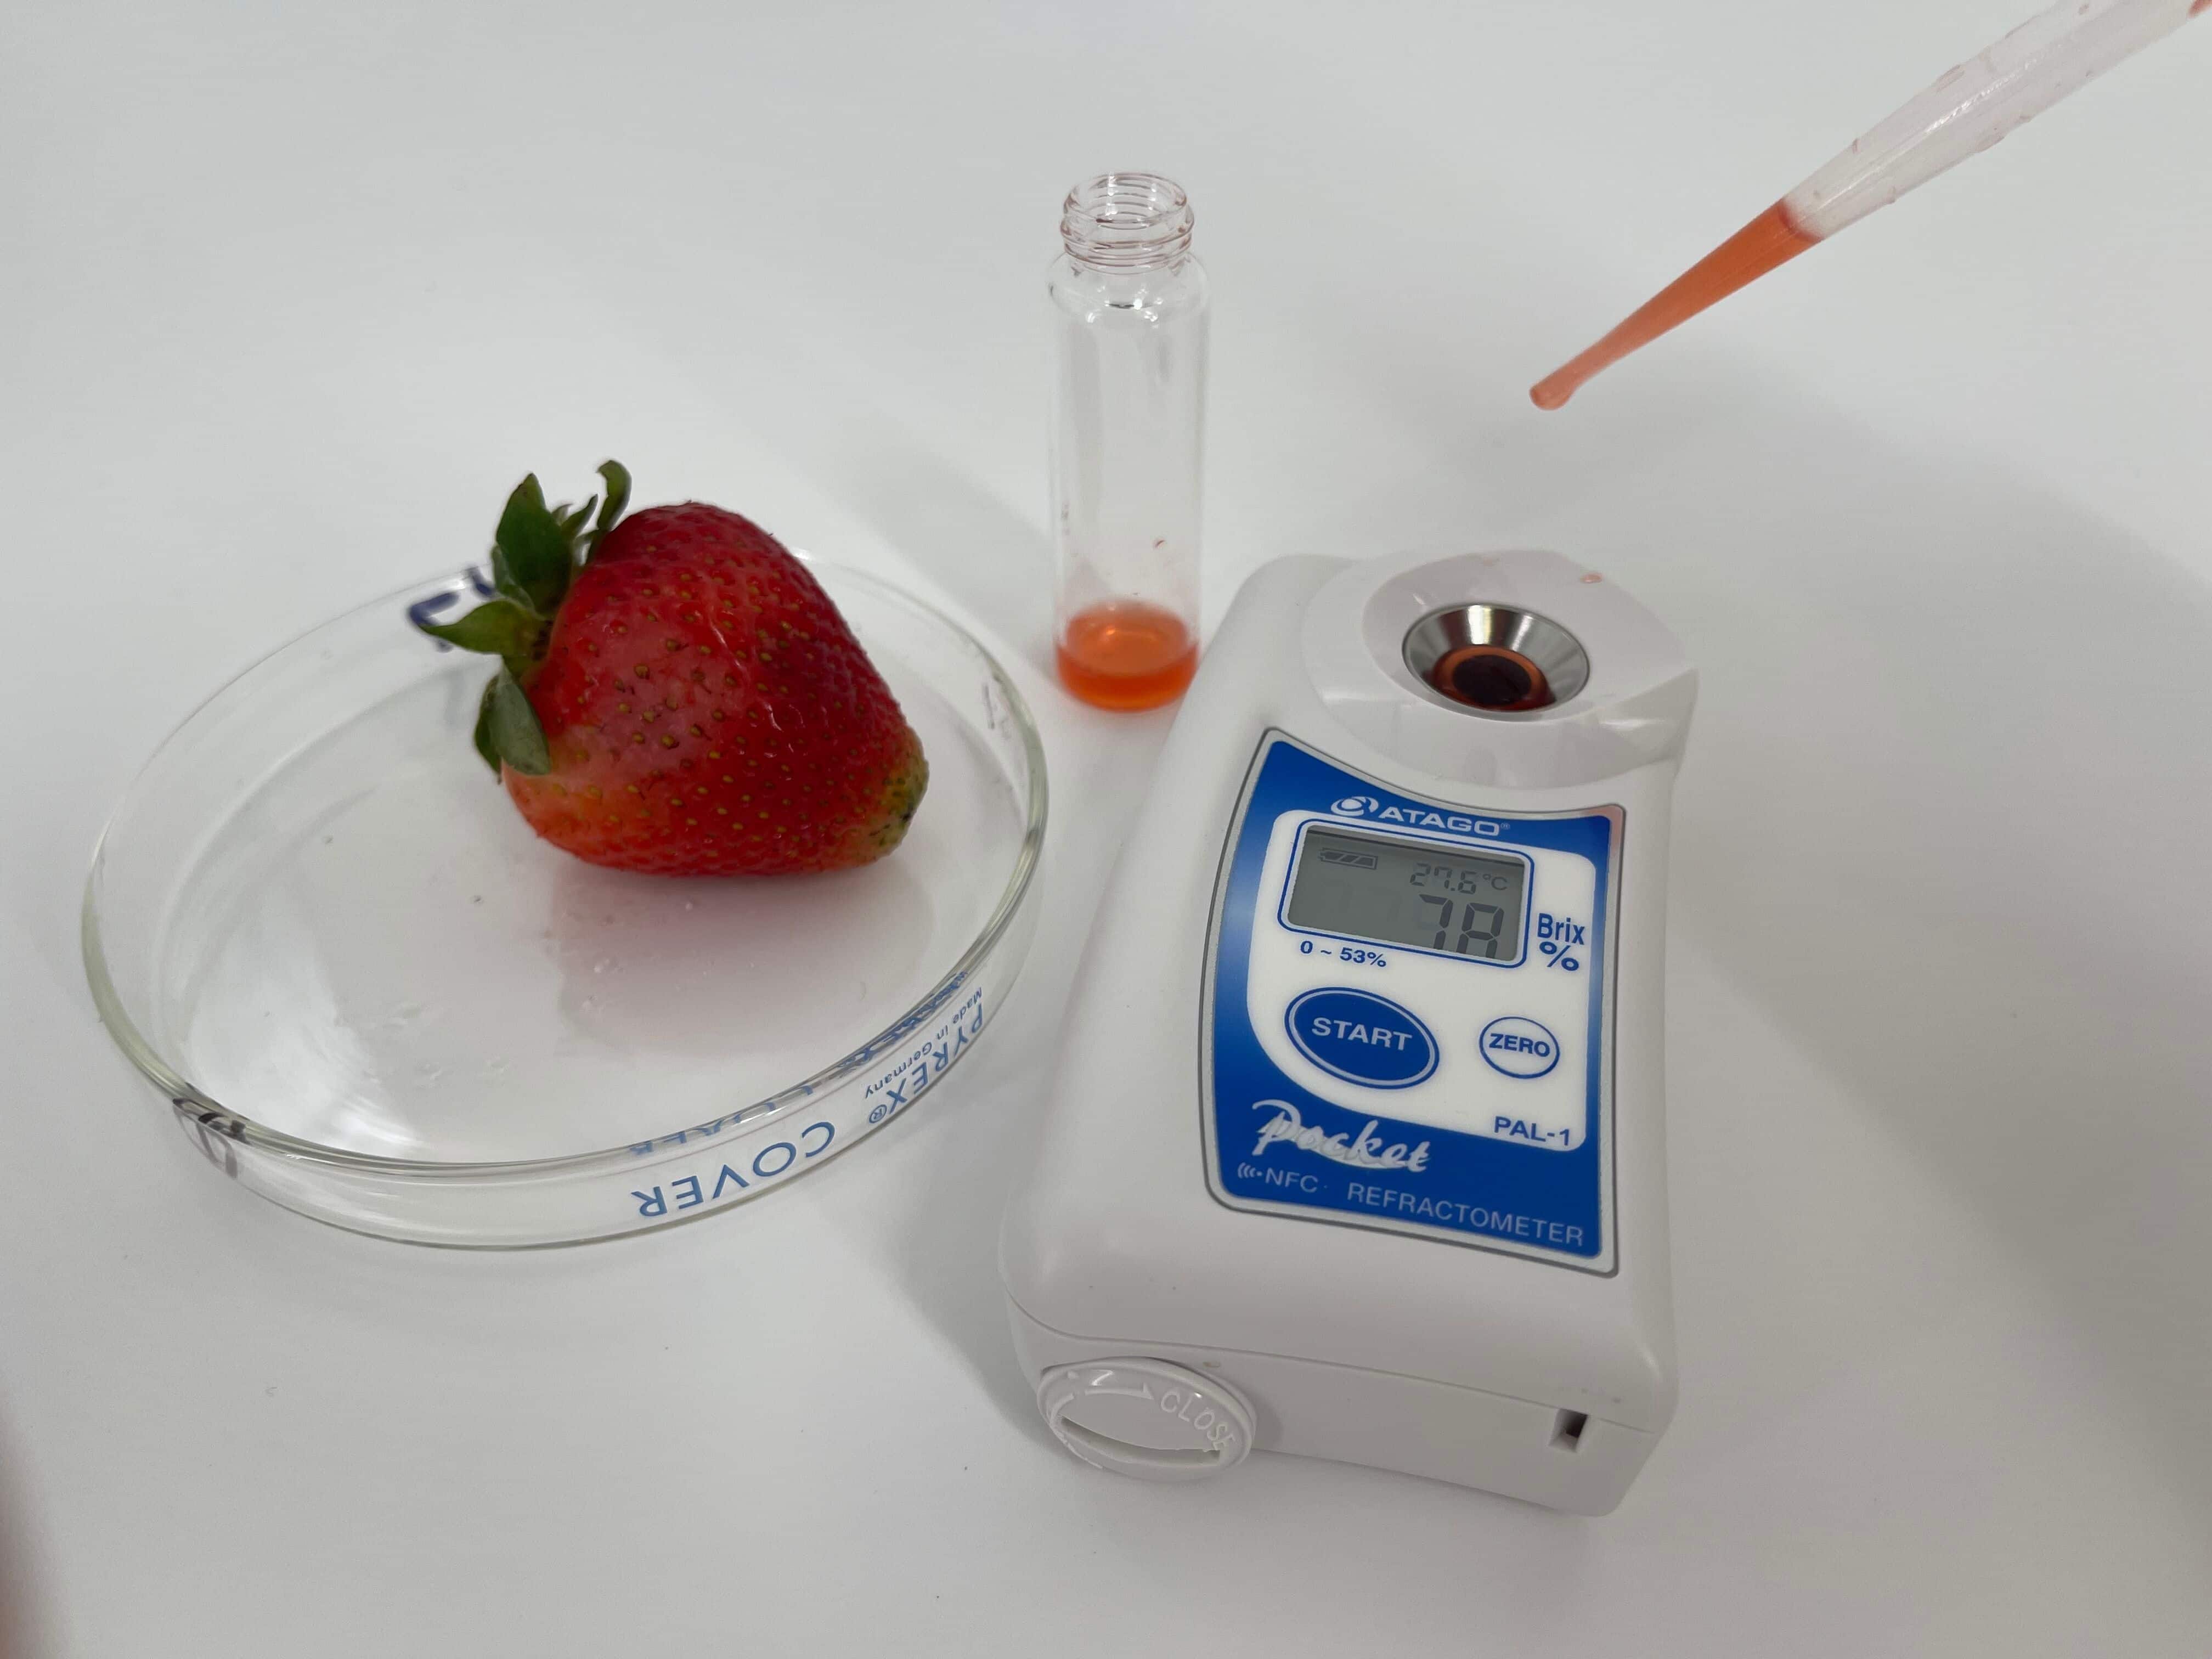
Brix is a measurement scale used to quantify the sugar content in a liquid, such as fruit juice. It represents the percentage of soluble solids, mainly sugars, in the liquid. Brix is measured using a refractometer, which calculates the refractive index of the liquid to determine its sugar concentration. As strawberries ripen, their sugar content increases, resulting in a sweeter taste. Brix measurement provides a quantitative assessment of this sweetness. When strawberries reach their optimal ripeness, they typically have a higher Brix reading, indicating a higher sugar content. The SpectraWizard used a refractometer to measure the corresponding BRIX value of each strawberry and saved the data with its recorded spectrum.
Total Acids
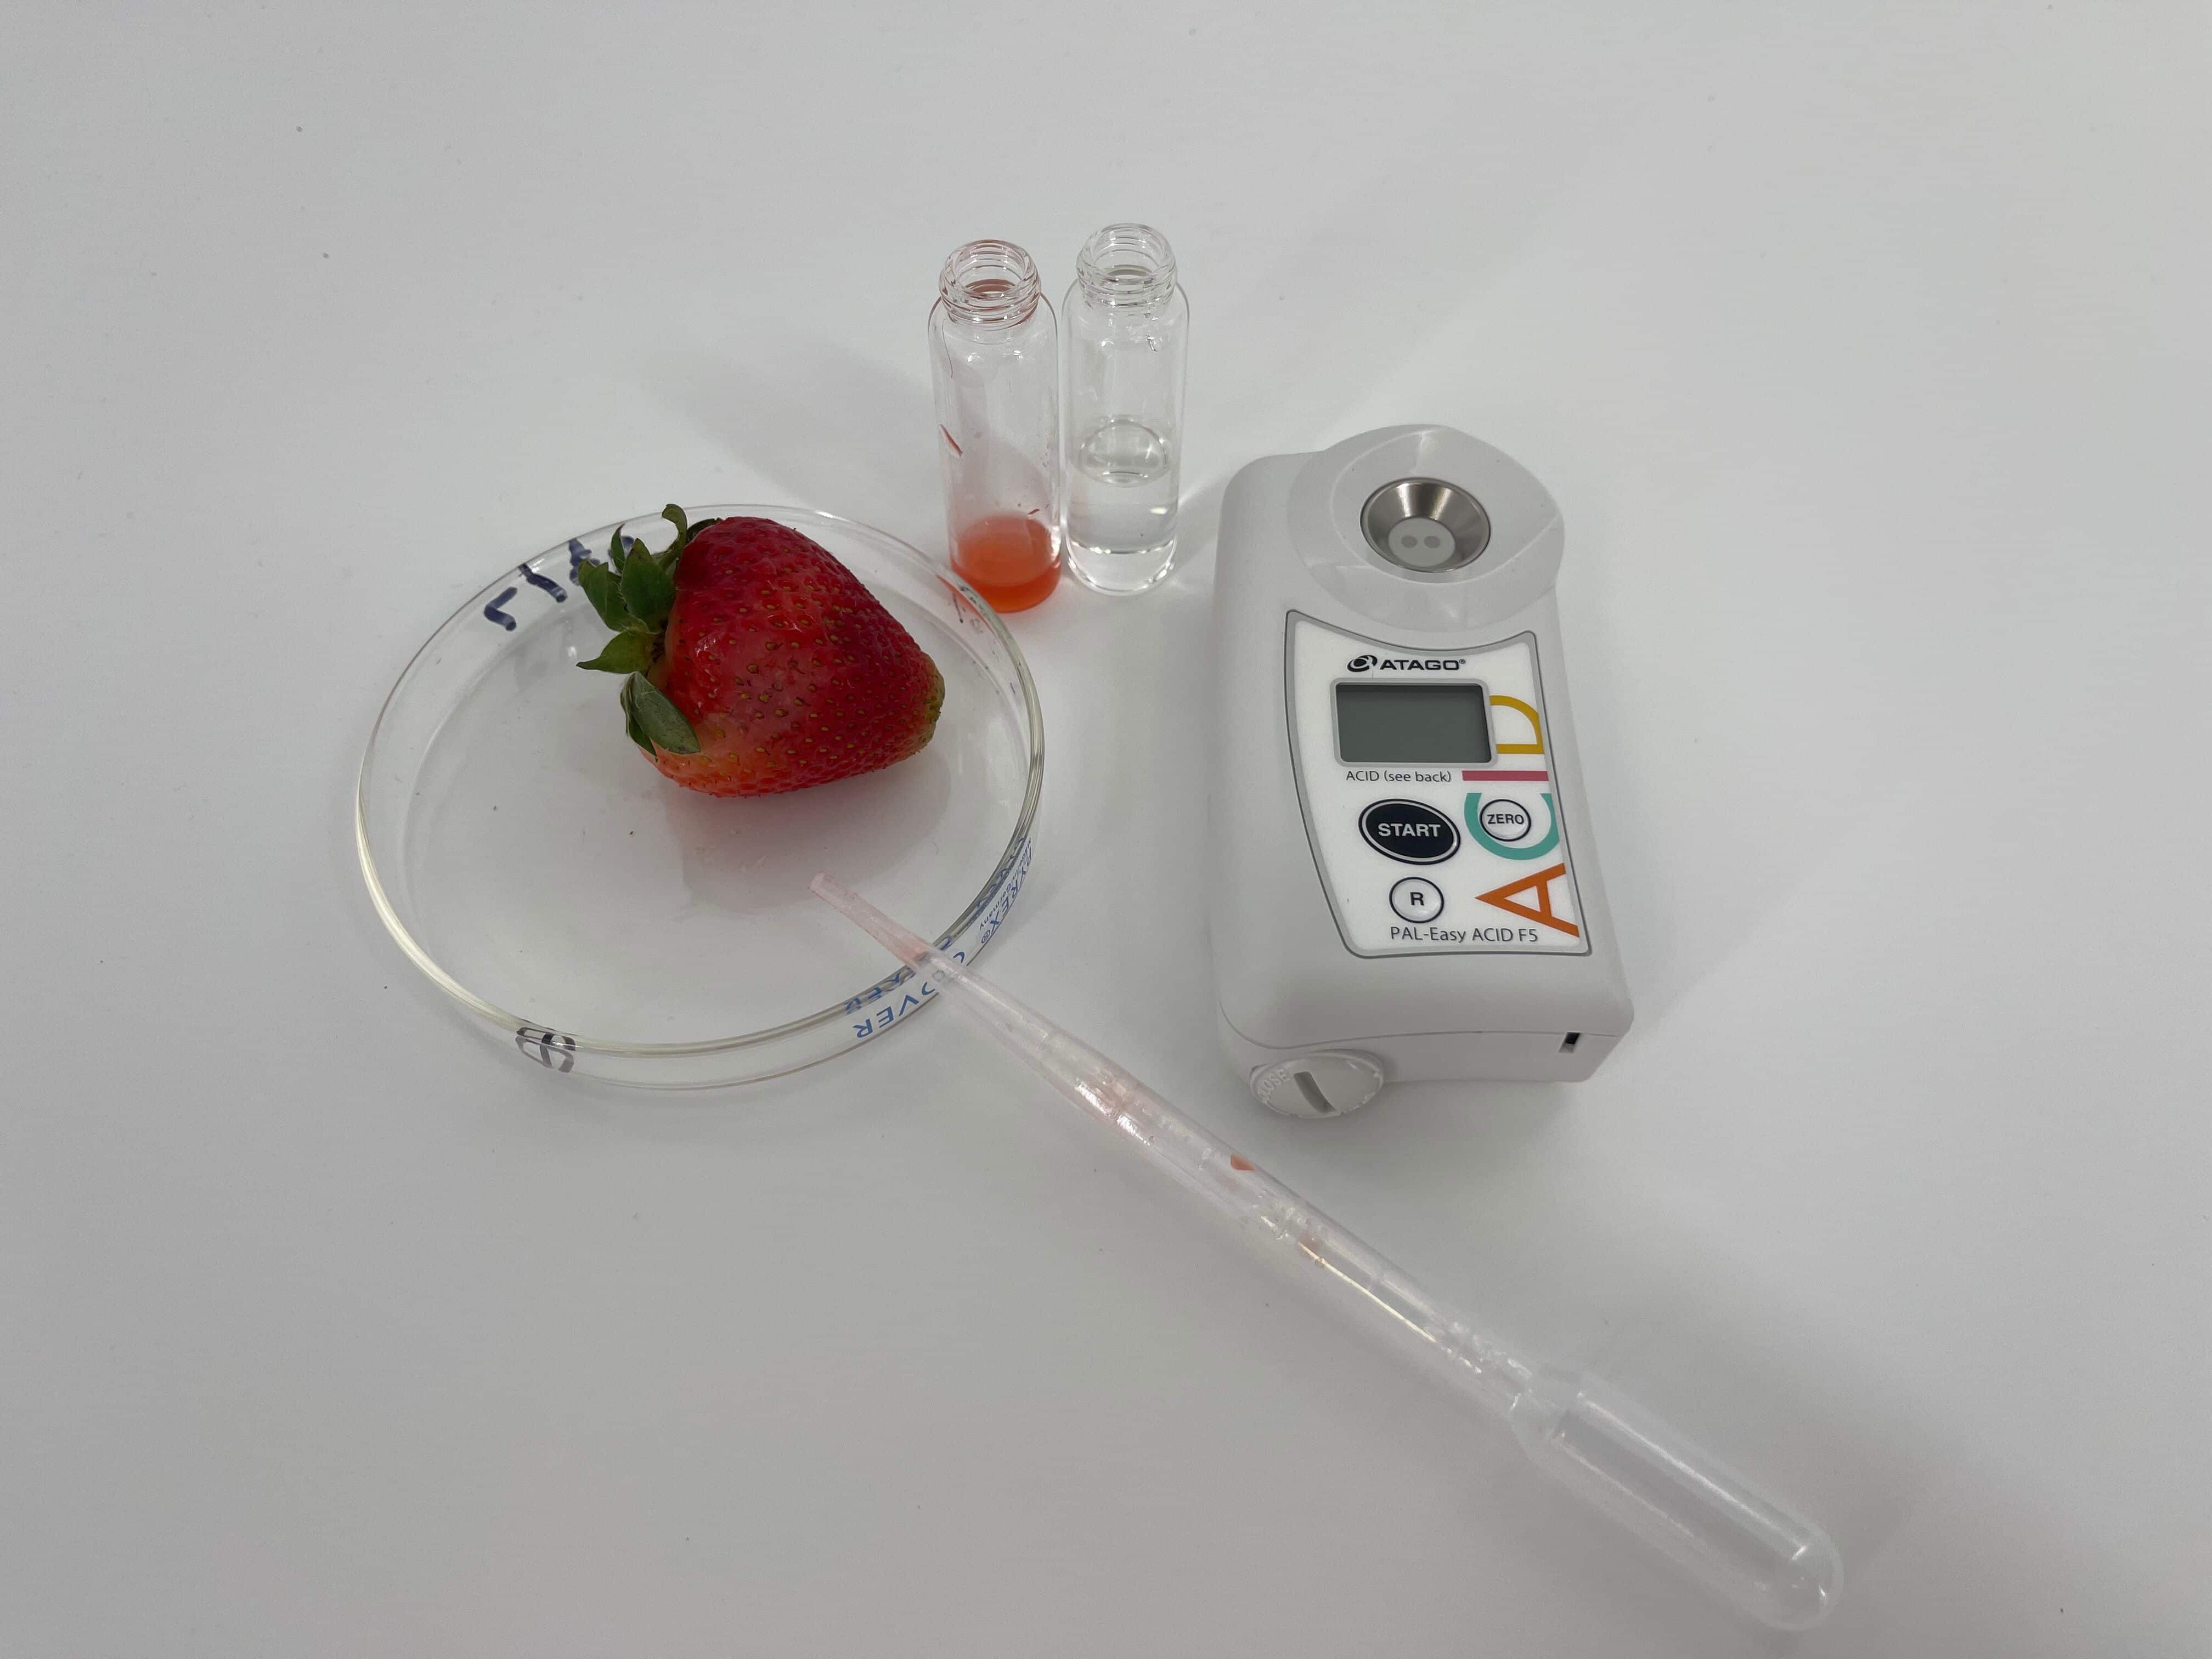
Total acids refer to the overall concentration of organic acids present in fruit, such as citric acid, malic acid, and tartaric acid. These acids contribute to the tart or sour taste of fruits and play a crucial role in flavor balance. As strawberries ripen, their total acid content generally decreases. By monitoring the total acid content, growers and researchers can assess the progression of strawberry ripening. Typically total acid measurements can be performed using acid-base titration using an indicator; however, the SpectraWizard has found some pocket devices from other manufacturers which produce similar values. He recorded the data for each strawberry and added it to the calibration.
Firmness
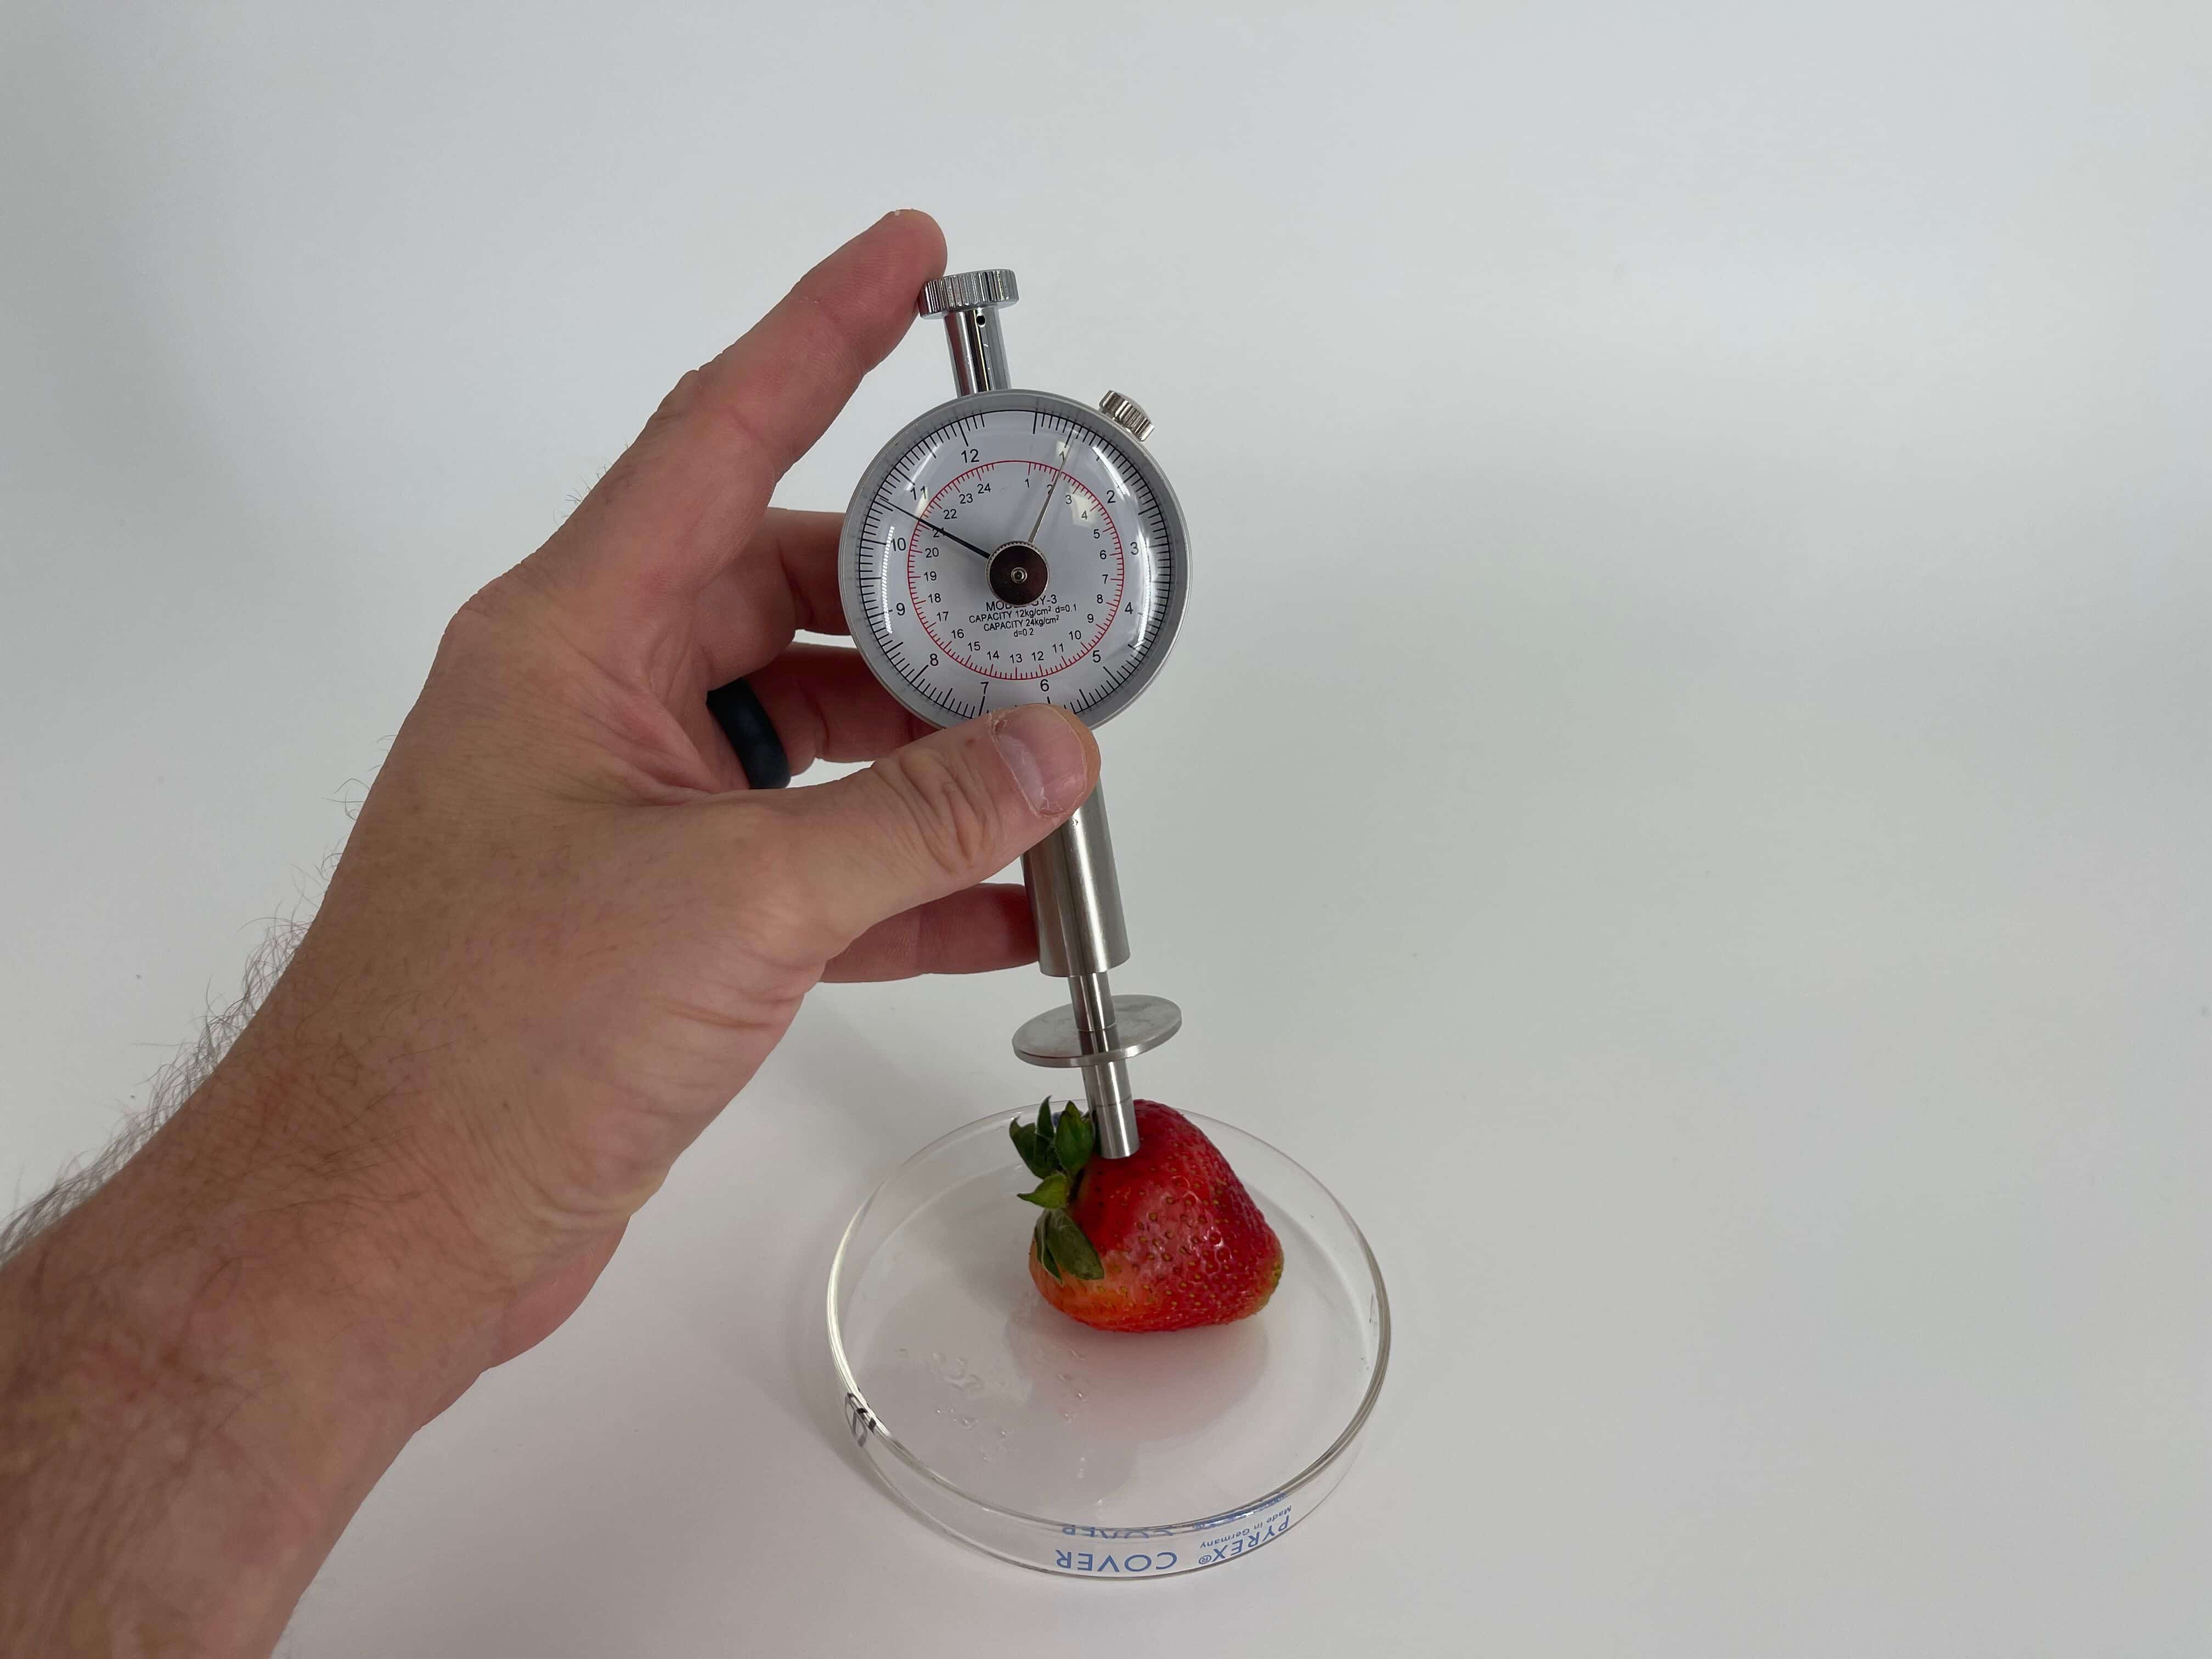
Strawberry firmness is an essential parameter used to predict ripeness. As strawberries ripen, their firmness gradually decreases. This softening is primarily attributed to the breakdown of cell walls and the degradation of pectin, a component responsible for maintaining cell structure and firmness. Fruits harvested at the appropriate firmness level are more likely to have desirable texture, transportability, and shelf life. Overripe strawberries tend to be excessively soft and prone to damage and decay. On the other hand, underripe strawberries may lack optimal juiciness and flavor. The SpectraWizard used a penetrometer to test each fruit’s firmness and recorded the data associated with each fruit and its spectrum.
SpectraWizard’s Quality Scale
The last metric used in the SpectraWizard’s strawberry quality calibration is his own subjective quality scale. That’s right, the SpectraWizard took a bite of every strawberry tested and gave it a quality value from 1-10. 10 being the best or “most ripe”.
The Ripe Conclusion
The SpectraWizard recorded data for several months adding his favorite (most ripe) strawberries as well as ones that clearly needed more time on the vine. The results of the calibration were fantastic with excellent correlation. The StellarPLS algorithm produced R2 values of over 0.8 for most quality parameters. This means that the SpectraWizard could use his new analyzer on any new strawberry he wanted to test and get predictive results of his own quality index without destroying or eating the fruit! This could even be performed on the vine. This would be very useful for farmers, distributors, and grocers when trying to make harvesting or purchasing decisions on large quantities of fruit. Strawberries in particular have a very narrow window of ripeness and prediction of fruit quality is essential in optimizing any fruit harvesting or distribution service. Contact the SpectraWizard and his team of application scientists to learn how this process can be applied to other fruits, foods, or types of products.
The SpectraWizard’s Famous Strawberry Shortcake!
When in a pinch, the SpectraWizard will use a pre-made shortcake, but for real magic, it’s best to make it from scratch.
Ingredients:
2 eggs
1 and 1/2 cup sugar (divided)
1 cup AP flour
1 tsp baking powder
1/4 tsp salt
1/2 cup milk
1 tbs butter
1tsp vanilla extract
2 pints of ripe, well-rinsed strawberries
Whipped cream (homemade is best – but store-bought is fine)
-Hull strawberries and slice them in half or smaller. Crush a handful of the berries with a fork to release juices. Mix berries and half a cup of sugar together. Cover and set aside for flavor to develop.
-Preheat oven to 350 deg. Grease a cupcake pan or 8-inch square baking pan.
-In a large bowl, beat eggs on medium speed. Gradually add 1 cup of sugar, beating until thick.
-In a second bowl, whisk flour, baking powder, and salt. Beat into egg mixture.
-In a small saucepan, heat milk and butter until butter just begins to melt. Beat into the batter with vanilla extract. Note: your batter will be thin
-Transfer the batter to greased pan. Bake for 25-30 minutes (use the toothpick test to check for doneness) Let cake cool completely.
Once your cake is cooled, scoop a hearty serving of your strawberries onto the cake and top with whipped cream!
We hope you enjoyed the SpectraWizard’s Spectroscopy BBQ!

