Introduction
The ripeness of an avocado affects its flavor, aroma, color and texture. Ripeness, however, is difficult to determine because the fruit ripens without obvious changes in external appearance. Dry matter content has been established as a surrogate for ripeness but requires cutting the fruit into small pieces and drying in a succession of time periods in a microwave oven or drying overnight in a convection oven (Lee et al., 1983). Researchers have demonstrated that near-infrared reflectance spectroscopy (NIRS) can predict the dry matter and subsequent ripeness of avocados (Olarewaju et. al, 2016).
Modern diode array spectrometers have reduced the number of moving parts, size, cost and environmental constraints on collecting reflectance spectra. Reflectance spectra arise from diffuse reflectance of light
on the sample. Depending on the physical and chemical characteristics of the sample subject, some incident light is absorbed, some is scattered, and some is reflected into the instrument’s optical pathway to the detector array. The NIRS technique assumes that light not reflected was selectively absorbed, depending on the chemical and physical characteristics of the subject. As a tool for predicting chemical properties, NIRS is particularly sensitive to organic molecules that contain C-H, O-H, and N-H. And, as such, is a great technique for prediction of moisture and subsequent dry matter content. In the wavelength range of the 900 – 1700 nm, the StellarCASE-NIRTM system would experience an overtone for water at about 1440nm.
Method
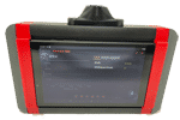
A StellarCASE-NIRTM system with RFX-3D reflectance fixture was utilized to demonstrate the efficacy of NIRS to predict dry matter content of avocados. Spectra were captured with the SpectraWiz software (Figures 1, 2).
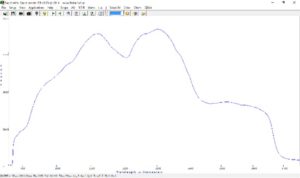
Figure 1. SpectraWiz depicting reflectance spectra.
Twenty Hass avocados were peeled, chopped through a food processor, placed into a 100-mm diameter glass petri dish and scanned five times with the spectrometer system. Avocados could have been directly scanned but this workflow facilitated the subsequent dry matter content analysis.
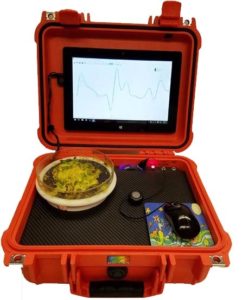
Figure 2. StellarCASE-NIRTM system with 3D field of view reflectance fixture.
Dry matter content was determined by loss on drying in a convection oven at 65 °C for a period of 24 hours (Figure 3).
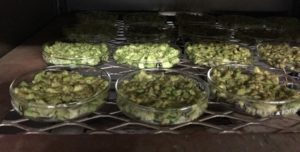
Figure 3. Samples drying in a convection oven.
A calibration to relate reflectance spectra to dry matter content was developed using the ChemWiz Analyzer Development Kit software (ChemWiz ADK). The ChemWiz ADK is a spreadsheet-like software with specific functions for building multivariate calibrations.
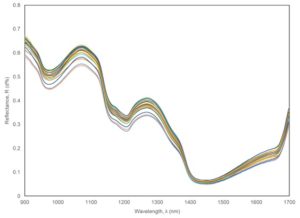
Figure 4. Reflectance spectra from the twenty avocados scanned with the StellarCASE-NIRS system.
The ChemWiz ADK was utilized to explore various mathematical preprocessing steps to improve the calibration performance.
Ideally, variability in spectra would only depend on the variable of interest (Figure 4). However, many factors influence how the light is absorbed, scattered and reflected by the sample. One such variation is optical path length. In our experiment, variations in the thickness of the petri dishes could have had an impact the spectra. Therefore, a standard normal variate and detrending correction was explored (Figure 5).
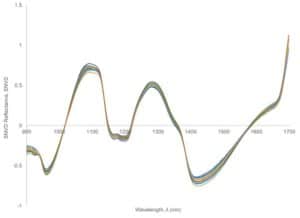
Figure 5. Reflectance spectra after standard normal variate and detrending correction.
Additionally, baseline shifts are common in spectroscopy. The spectral baseline can shift due to variations in output from the light source and drift in the detector. By taking the derivative of the spectra, these effects can be minimized as the slope of a curve is not affected by changes in the baseline (Figure 5).
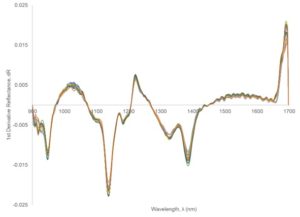
Figure 6. Reflectance spectra after 1st derivative correction.
Next we need to determine which wavelengths should be used for predictor variables. The spectra that we have collected contain many variables that could be used for prediction. Furthermore, the reflectance measured at each wavelength is not completely independent from adjacent wavelengths. Spectroscopists utilize a calibration technique known as partial least squares regression (PLSR) to solve these problems. PLSR constructs new predictor variables, known as components, as linear combinations of the original predictor variables that are then compared to the response variable to select which components are most promising for regression.
Finally, we need to assess the performance of our model. The performance of the calibration model is ideally evaluated by predicting moisture contents of an independent set of avocados. Since we have only scanned twenty avocados we take an admittedly less conservative approach known as cross-validation to estimate performance. Cross-validation estimates the efficacy of a model by building a successive set of calibrations where one or more samples are left out and predicted. Summary statistics such as root mean standard error of cross-validation (RMSECV) and coefficient of determination are determined by these validation sets.
Results
A calibration model was constructed with an RMSECV of 0.68 % DM and an r2 of 0.87. The SNV math treatment was employed and four principle components were used (Figure 7).
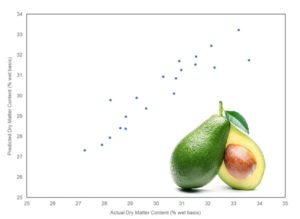
Figure 7. Predicted vs. actual dry matter.
In addition to the work shown here, the ChemWiz ADK provides extended functions and plots to assess the model and the influence that each predictor variable and data point has on the model.
Conclusion
This proof of concept demonstrates the efficacy of NIRS method to predict the dry matter content of avocados. However, the model may have limited application in many production settings. Further work would be necessary to include the normal variability in avocados expected in your operation. For example, freshly picked avocados would be outside the variability encompassed in this model. Furthermore, you may want to predict moisture in different varieties of avocados or those originating from different growing regions.
One of the principal challenges associated with model development is balancing calibration performance with overfitting the model. A successful NIRS model will limit unnecessary variability, include variability that is not controllable, cover the range values of the predicted variable and will judiciously apply math preprocessing corrections and predictor variables.
Sources
Lee, R. E. Young, P. M. Schiffman, and C. W. Coggins, Jr. 1983. Maturity Studies of Avocado Fruit Based on Picking Dates and Dry Weight. J. Amer. Soc. Hort. Sci. 108(3):390-394.
Olarewaju, O, Bertling, I., and L. Magwaza. 2016. Non-destructive evaluation of avocado fruit maturity using near infrared spectroscopy and PLS regression models. Scientia Horticulturae. 199:229-236.

By Matthew Digman, Ph. D.
Assistant Professor of Agricultural Engineering
Technical Staff Writer