EJ Olson, CN Tzouanas, JJ Tabor – Molecular Systems Biology, 2017
Abstract
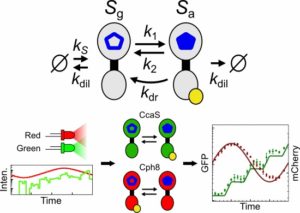
Optogenetics combines externally applied light signals and genetically engineered photoreceptors to control cellular processes with unmatched precision. Here, we develop a mathematical model of wavelength‐ and intensity‐dependent photoconversion, signaling, and output gene expression for our two previously engineered light‐sensing Escherichia coli two‐component systems. To parameterize the model, we develop a simple set of spectral and dynamical calibration experiments using our recent open‐source “Light Plate Apparatus” device. In principle, the parameterized model should predict the gene expression response to any time‐varying signal from any mixture of light sources with known spectra. We validate this capability experimentally using a suite of challenging light sources and signals very different from those used during the parameterization process. Furthermore, we use the model to compensate for significant spectral cross‐reactivity inherent to the two sensors in order to develop a new method for programming two simultaneous and independent gene expression signals within the same cell. Our optogenetic multiplexing method will enable powerful new interrogations of how metabolic, signaling, and decision‐making pathways integrate multiple input signals.

LED measurement
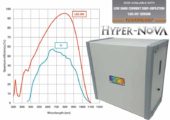
All LEDs were measured and calibrated using a spectrometer (StellarNet SILVER-Nova‐25 LT16) with NIST‐traceable factory calibrations performed on both its wavelength and intensity axes immediately prior to use for this study. A six‐inch integrating sphere (StellarNet IS6) was used, enabling measurement of the total power output of each LED (in μmol s−1). The spectrophotometer was blanked by a measurement of a dark sample before each LED measurement. Measurements were saved as .IRR files, which contain the complete LED spectral power density Plight (λ) (μmol s−1 nm−1) in 0.5 nm increments as well as all setup parameters for the measurement (i.e., integration time and number of scans to average). These files were processed by Python scripts to calculate the LED characteristics, including the peak, centroid, FWHM, and total power. For spectral validation experiments, cinematic lighting filters (Roscolux) were cut, formed into LED‐shaped caps, and fitted atop white LEDs.


