Spectroscopy is one of the most valuable tools that an astronomer has for studying the Universe. Spectrometers help us determine the chemical compositions, physical properties, and velocities of astronomical bodies light-years away.
Pioneering Scientists
If you have seen a rainbow, you have witnessed how the light of the sun can be broken up into a spectrum of visible wavelengths of light. Issac Newton (1643-1727) first showed that sunlight could be separated into a series of colors using a prism. Joseph von Fraunhofer (1787-1826) extended the work of Newton by discovering the dark bands that are seen in the sun’s spectrum when it is separated. It wouldn’t be until the work of Gustav Kirchoff (1824-1887) and Robert Bunsen (1811-1899) that the reason these bands were seen would be explained. They proposed that the dark bands in the spectrum were due to absorption of the spectrum formed by the hot interior of the sun by the cooler gases at the surface. The spectra of stars were first visually observed by Fraunhofer and Angelo Secchi (1818-1878) – both may be credited with having found the science of astronomical spectroscopy.
Spectroscopy Basics
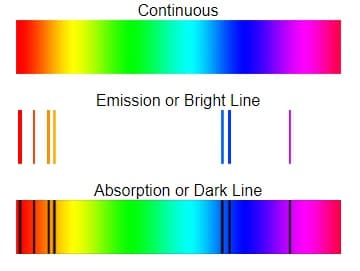
Each element in the periodic table can appear in a gaseous form. In this form, it will produce a series of bright lines that are unique to that element, like a fingerprint. Hydrogen, helium, and sodium for example will all have unique elemental fingerprints. From these spectral lines, astronomers can determine the temperature and density of the material in that star. The spectral lines can also tell us if there is a magnetic field for the star and more about it. The width of the lines can tell us how fast the material is moving.
The spectral lines can also teach us about wind in stars. If we see the lines shift back and forth we can see that the star might be orbiting another star – this allows us to estimate the size and mass of the star. If the lines grow and fade in strength – this can tell us about the physical changes the star may be undergoing. Spectroscopy is one of the fundamental tools which scientists use to study and understand the Universe.
Colors and Temperatures of Stars
Heating a dense gas or material will cause it to glow. As the gas heats up, the particles in the gas collide causing radiation. The radiation is randomized and ends up spread across a broad range of wavelengths, but it peaks at a wavelength that is related to the temperature. Therefore, Stars are great approximations of blackbody radiators. The visible color of a star depends on the temperature of the radiator!
The curves above show blue, white, and red stars. We adjust the white star to 5270K so that the peak of the curve is at the peak wavelength of the sun (550nm). Using the Wein displacement law, we can determine the temperature of the star.
Doppler Effect for Optical SpectroAstronomy
The Doppler effect of light collected from stars is of great use in astronomy and results in either a redshift or blueshift in the elemental fingerprints. The Doppler effect can be used to measure the speed at which stars and galaxies are either approaching or receding from us (called radial velocity). We can use this information to detect if a seemingly single star is really a close binary system. The Doppler effect can also be used to measure the rotation speed of stars and galaxies or to detect exoplanets. The redshift and blueshift happen on a very small scale.
The Doppler effect tells us that the spectral lines of an approaching astronomical light source exhibit a blueshift, and those of a receding astronomical light source exhibit a redshift.
A high velocity star is a star moving faster than 65 km/s to 100 km/s relative to the average motion of the stars in the Sun’s neighborhood.


