A grating efficiency curve shows how efficient a grating is at diffracting light at each wavelength. Below is a grating efficiency curve for the VIS BLUE-Wave spectrometer model:
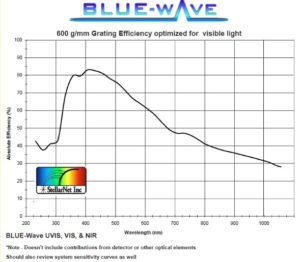
Absolute efficiency (%) is plotted versus wavelength. At 500 nm, the efficiency is ~75%. This means that 75% of the 500 nm light that hit the grating was diffracted with the correct geometry to hit the detector, i.e. the first order light. The remaining 25% of the light is likely diffracted into other orders.
Experimental Considerations: This curve only shows the efficiency of the grating. Each element in the spectrometer also has an efficiency associated with it. The overall efficiency of the spectrometer is the combined efficiency of all the elements. For example, the above grating is highly efficient at 400 nm, but if the detector is not efficient at 400 nm, the spectrometer will not be efficient at 400 nm.
The BLACK-Comet line of spectrometer are known for having the smoothest and most uniform grating efficiency curve on the planet. More info