Shavini Wijesuriya, Krishna Burugapalli, Ruth Mackay, Godwin Chukwuebuka Ajaezi and Wamadeva Balachandran
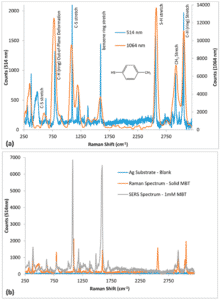
Surface-enhanced Raman spectroscopy (SERS) substrates manufactured using complex nano-patterning techniques have become the norm. However, their cost of manufacture makes them unaffordable to incorporate into most biosensors. The technique shown in this paper is low-cost, reliable and highly sensitive. Chemical etching of solid Ag metal was used to produce simple, yet robust SERS substrates with broadband characteristics. Etching with ammonium hydroxide (NH4OH) and nitric acid (HNO3) helped obtain roughened Ag SERS substrates. Scanning electron microscopy (SEM) and interferometry were used to visualize and quantify surface roughness. Flattened Ag wires had inherent, but non-uniform roughness having peaks and valleys in the microscale. NH4OH treatment removed dirt and smoothened the surface, while HNO3 treatment produced a flake-like morphology with visibly more surface roughness features on Ag metal. SERS efficacy was tested using 4-methylbenzenethiol (MBT). The best SERS enhancement for 1 mM MBT was observed for Ag metal etched for 30 s in NH4OH followed by 10 s in HNO3. Further, MBT could be quantified with detection limits of 1 pM and 100 µM, respectively, using 514 nm and 1064 nm Raman spectrometers. Thus, a rapid and less energy intensive method for producing solid Ag SERS substrate and its efficacy in analyte sensing was demonstrated.